Greenhouse gas emissions projections: phase 1 and phase 2 modelling results
Analysis undertaken by Ricardo-AEA for the Scottish Government to provide an estimated projection of Scottish emissions from 2019 to 2045 which capture announced Scottish and UK policies.
5. Buildings sector
5.1 Sector Overview
5.1.1 Sector Background
Although emissions from the Buildings sector by source are relatively modest, end use emissions – which consider the GHG emissions from electricity use and the direct consumption of fuel – are much larger. Emissions from buildings in the Services and Residential Climate Change Plan (CCP) reporting categories accounted for just over 20% (8.6 MtCO2e) of Scotland's emissions in 2020.[13] In terms of targeting GHG emission reductions, the Building sector is therefore important.
The Climate Change Plan Update (CCPu)[14] states that there will be a major shift in the type of energy consumed from fossil fuels to electrical energy: "The zero emissions heat transition will involve […] moving from high emissions heating systems, reliant on fossil fuels, to low and zero emissions systems such as heat pumps, heat networks and potentially hydrogen."
5.1.2 Subsectors Considered
The Buildings sector was disaggregated into the following subsectors:
- Domestic – owner occupied
- Domestic – private rented
- Domestic – social rented
- Non-domestic – public
- Non-domestic – other (includes commercial buildings, as well as buildings associated with Agriculture and Industry
- Miscellaneous – includes refrigerants, solvents & aerosols, accidental fires, and home composting, which are allocated to the buildings sector in the inventory
The structure of the Buildings sector, as modelled in this study, is shown below. Note that no measures were modelled for the 'Miscellaneous' category.
Figure 5‑1. A visualisation of the disaggregation of the Buildings sector
Domestic
- Owner-occupied
- Private rented
- Social housing
Non-Domestic
- Public sector
- Other non-domestic (commercial, industrial, agricultural)
Misc.
- Refrigerants
- Solvents & aerosols
- Accidental fires
- Home composting
5.1.3 Data Sources
The main data sources used to undertake the assessment of the Buildings sector are detailed in Table 5‑1 below.
| Purpose | Data used | Comment |
|---|---|---|
| GHG inventory for Scotland | UK National Atmospheric Emissions Inventory (UK NAEI) | GHG inventory for Scotland needed to estimate impacts of policies on emissions. |
| Energy consumption in Scotland | BEIS Sub-National Total Final Energy Consumption | Energy consumption in Scotland needed to estimate impacts of policies on energy use. |
| Disaggregating non-domestic fuel consumption and electricity data | Digest of UK Energy Statistics (DUKES) | Split (%) of non-domestic energy use (i.e., between commercial, public, agricultural buildings, and industrial buildings) used to inform disaggregation of non-domestic energy use by sub-sector. |
| Disaggregating domestic fuel consumption and electricity data | Scottish Housing Survey (SHS) | Tenure split (%) of domestic buildings in Scotland used to disaggregate domestic energy use by sub-sector. |
| Split of fuel consumption by end use | Energy Consumption in the UK (ECUK) End Use Tables | Fuel consumption by sector and end use (%) was used to ensure that measures impacting heat demand were scaled based on the proportion of energy used for that purpose in each sub-sector. |
A wide variety of other datasets have been referred to in order to assess the impacts of individual policies. These additional references are provided for each policy below in Appendix 3.
5.1.4 Underlying Drivers of Energy & Emissions
There are many drivers of energy use in this sector, including but not limited to: energy efficiency, energy prices, weather, the number and type of buildings, consumer behaviour, household incomes, and standards of repair/maintenance.
Within buildings and other stationary facilities, energy may be used for a variety of purposes. In domestic buildings, energy uses tend to be dominated by space and water heating, lighting, cooking, and electronic appliances. In non-domestic buildings, these may represent a smaller portion of overall energy use, due to the additional presence of (for example) ventilation and air conditioning systems, lifts, escalators, IT, refrigeration, and other equipment or machinery.
For the purpose of this assessment, given the constraints on scope and budget, we have assumed that the main driver of emissions in the domestic sector is the number of dwellings. In the absence of data on the anticipated number and timing of new housing delivery, we have used National Records of Scotland (NRS) projections of household numbers as a rough proxy.[15]
In the non-domestic sector, the number of buildings is assumed to be less of a key driver than the scale and type of economic activities that are being carried out within those buildings. Therefore, as a simplifying assumption, for the purpose of this assessment we have scaled growth in the non-domestic sector with projected changes in GVA.
5.2 Policy Measures and Outcomes Modelled
5.2.1 Phase 1 – Policy Measures
For the Buildings sector, there were 48 policies to be assessed. However, there was a lack of available data to quantify many of these policies. Instead, policies were split into packages covering similar themes, to allow policies targeting the same measures to be assessed together and thus ensure interactions between similar policies/proposals were captured. For example, there are multiple policies addressing energy efficiency in existing buildings, which will have a combined effect on the energy demands of the building stock.
The table below shows the packaging of policies into key themes, and the quantifiable targets informing the assessment. Note that, at the request of the Scottish Government, some of the targets were taken from the Heat in Buildings Strategy but may not be in the CCPu.[16]
| Theme | Quantifiable targets | Relevant policies / strategies / actions |
|---|---|---|
| Existing buildings | ||
| Upgrade fabric efficiency | From the Heat in Buildings Strategy:
|
|
| Theme | Quantifiable targets | Relevant policies / strategies / actions |
|---|---|---|
| Existing buildings | ||
| Replacement of heating systems |
|
|
| Installation of smart meters |
|
|
| Theme | Quantifiable targets | Relevant policies / strategies / actions |
|---|---|---|
| New buildings | ||
| Energy efficiency | N/a – technical standards have not yet been set at time of analysis |
|
| Low carbon heating systems | All new buildings to have zero carbon heating systems from 2024 |
|
| Miscellaneous | ||
| Renewable electricity generation | No quantifiable targets for renewable electricity generation in buildings[17]; however, the Scottish Government aims to achieve 2GW of community and locally owned energy by 2030 |
|
| District Heat Networks (DHNs) | From the Heat in Buildings Strategy: "As part of the Heat Networks (Scotland) Act we have new targets for the amount of heat to be supplied by heat networks. These require the combined supply of thermal energy by heat networks to reach 2.6 TWh of output by 2027 and 6 TWh of output by 2030. This is 3% and 8% respectively of current heat supply." |
|
| Hydrogen | "Progress to 20% of Scottish gas demand accounted for by biomethane and hydrogen blended into the gas network by 2030." |
|
Details of the modelling approach taken for each policy are provided in Appendix 3.
In agreement with Scottish Government, the above list was reviewed to identify quantifiable policies and targets. In Phase 1, these were:
- Energy Company Obligation 2020-2026
- Smart meter installation
- New Build Heat Standard
- Heat in Buildings Regulation
- Upgrade homes to EPC 'C' [owner occupied and private rented only] or EPC 'B' [social housing only]
- Scottish Green Public Sector Estate Scheme
- Renewable Heat Incentive 2020-2022
- Decarbonise equivalent of 50,000 non-domestic buildings
- HiBS domestic and SME Delivery Schemes
5.2.2 Phase 2 – Outcomes
A workshop was held between representatives of the Scottish Government and Ricardo Energy & Environment to discuss options for modelling additional targets as part of Phase 2 of the Provision of Emissions Projections project. The workshop highlighted a few instances where a policy that was modelled in Phase 1 have been reframed; for example, the policy goal of decarbonising the equivalent of 50,000 non-domestic buildings by 2030 has been reframed as part of the policy goal of reducing service sector fossil fuel heat consumption to 5,000 GWh per year by 2030. However, because the focus in Phase 2 is on overall targets rather than individual policies, this has no impact on the results.
As part of Phase 2, it was agreed that the modelling would assume 400,000 on-gas homes are converted to ZDEH technologies by 2030, with the remaining stock of on-gas homes being converted to ZDEH between 2030 and 2045. The Scottish Government are developing proposals for regulations which would be designed to deliver a pathway towards their target of over 1 million on-gas homes converting to ZDEH by 2030, and aim to consult on these proposals as part of a Heat in Buildings Bill in 2023. The smaller number of 400,000 assumed in this assessment is intended to illustrate the effect that any delay or amendments made as a result of the consultation and Parliamentary processes may have on the pace and extent of compliance that the proposed regulations may deliver.
The table below shows the additional targets that were considered during Phase 2. These are predominately based on the targets listed in the Climate Change Plan Monitoring Report 2022, although they have been modified to reflect subsequent discussions between Ricardo and Scottish Government.
| Outcome | Target(s) |
|---|---|
| 1. The heat supply to our homes and non-domestic buildings is very substantially decarbonised, with high penetration rates of renewable and zero emissions heating | 1. Zero Direct Emission Heating (ZDEH):
|
| 2. Reduce service sector fossil fuel heat demand to 5,000 GWh by 2030. | |
| 2. Our homes and buildings are highly energy efficient, with all buildings upgraded where it is appropriate to do so, and new buildings achieving ultra-high levels of fabric efficiency | 3. Reduce energy intensity of residential buildings (MWh per household) by at least 30% by 2032 (on 2015 levels). |
| 4. All homes have EPC C or equivalent (or higher) by 2033, where technically feasible and cost-effective including backstop dates. | |
| 5. Reduce emissions intensity of non-domestic buildings (tCO2e per GVA) by 20% by 2025 and 30% by 2032 compared with 2015. | |
| 3. Our gas network supplies an increasing proportion of green gas (hydrogen and biomethane) and is made ready for a fully decarbonised gas future | 6. Progress to 20% of Scottish gas demand accounted for by biomethane and hydrogen blended into the gas network by 2030. |
| 4. The heat transition is fair, leaving no-one behind and stimulates employment opportunities as part of the green recovery | 7. Not quantifiable |
There are interactions between some of these targets:
- In the domestic sector:
- Improving EPC ratings will reduce the impact of switching to ZDEH. This is because, once the buildings are upgraded to be more energy efficient, emissions from heating are assumed to be reduced, so when these heating systems are replaced with zero emission alternatives, the emissions savings will be lower. Despite this, improving energy efficiency is necessary in order to improve the performance of ZDEH systems and reduce electricity demand.
- Improving EPC ratings and switching to ZDEH will both contribute towards reducing the energy intensity of domestic buildings. Conversely, reducing the energy intensity of domestic buildings would likely involve improving EPC ratings and switching to ZDEH. Therefore, modelling the energy intensity target simultaneously with the EPC and ZDEH targets would result in double-counting.
- In the non-domestic sector:
- Reducing fossil fuel consumption to 5,000 GWh per year is expected to reduce the emissions intensity. Conversely (similar to the domestic sector, see previous bullet point) reducing emissions intensity will likely involve reducing fossil fuel consumption.
- Blending "green gas" into the gas grid would impact the calculated emissions savings from all of the other targets for both the domestic and non-domestic sectors. For example, if the gas grid is blended with hydrogen, emissions from gas would be lower, which means that the impact of increasing energy efficiency and switching to ZDEH would be lessened.
Because some of these targets contribute towards one another, it was not possible to model all of them separately. In particular, our calculations suggest that Target 3 (reduce domestic energy intensity) and Target 5 (reduce non-domestic emissions intensity) would be met or exceeded if the other targets were achieved.
The table below compares the policies that were quantified in Phase 1 versus Phase 2.
| Description | Phase 1 | Phase 2 |
|---|---|---|
| Energy Company Obligation 2020-2026 | ✓ | |
| Smart meter installation | ✓ | |
| New Build Heat Standard | ✓ | ✓ |
| Heat in Buildings Regulation* | ✓ | ✓ |
| Upgrade remaining homes to EPC 'C' [owner occupied and private rented only] | ✓ | ✓ |
| Upgrade remaining homes to EPC 'B' [social housing only] | ✓ | ✓ |
| Scottish Green Public Sector Estate Scheme | ✓ | |
| Renewable Heat Incentive 2020-2022 | ✓ | |
| Decarbonise equivalent of 50,000 non-domestic buildings** | ✓ | |
| Reduce service sector fossil fuel demand to 5,000 GWh per year | ✓ | |
| HiBS domestic and SME Delivery Schemes *** | ✓ | |
| Blend biomethane and hydrogen into the gas network | ✓ |
* In Phase 1, this was implemented starting in 2030. In Phase 2, all off-gas homes heated by fossil fuels are converted to ZDEH between 2025 and 2030. A further 400,000 on-gas homes are converted to ZDEH by 2030. The remaining on-gas homes are then converted linearly between 2030 and 2045.
** This target was reframed after Phase 1 to be included as part of the target of reducing service sector fossil fuel demand to 5,000 GWh p.a.
*** Including the ABS, WHS and HES plus the additional capital funding announced as part of the Bute House Agreement
To summarise the differences between these: In Phase 1, we modelled the impacts of EPC upgrades to domestic buildings, and the proposed Heat in Buildings Regulation which would see all buildings switch to zero direct emission heating (ZDEH), alongside specific initiatives such as the Energy Company Obligation, smart meter installations, HiBS domestic and SME Delivery Schemes and the Scottish Green Public Sector Estate Scheme. In Phase 2, we modelled EPC upgrades to domestic buildings, reducing service sector fossil fuel demand to 5,000 GWh per year, and the entire building stock transitioning to ZDEH. Initiatives such as the HiBS domestic and SME Delivery Schemes were assumed to contribute to those outcomes so were not modelled separately. Also in Phase 2, the 'High Hydrogen' scenario explored the impact of blending up to 20% green hydrogen into the gas network by as an interim measure prior to the wider adoption of electrically powered ZDEH.
Other points to note:
- Whereas in Phase 1, some policies were modelled differently depending on high/low economic growth, reflecting (for example) greater uptake of some mitigation measures in the event that more funding was available, in Phase 2, growth is assumed to be the same across each scenario, so there is no difference between them. The exception is the 'High Hydrogen' scenario, where the key difference is that green hydrogen is assumed to be blended into the gas grid at 20% by volume by 2030.
- As in Phase 1, the target of improving EPC ratings was taken as a proxy for improving energy efficiency, even though at present this can be achieved through changing heating systems or installing renewable technologies as well.
5.2.3 Summary of Policy Packages
The table below indicates which policies were found to have the biggest potential impact within each package, which policies overlap with (or reinforce) each other, and which policies act as supporting measures.[18]
Note that energy efficiency measures in existing buildings were split between those that are funded as part of Scottish Government schemes (such as the Area-Based Schemes, Warmer Homes Scotland and Home Energy Scotland), and those that would rely on other sources of funding to be delivered (such as the minimum EPC standards for private rented properties).
| Policy Package | Policy | Categorisation |
|---|---|---|
| B1 Energy efficiency measures (SG funded) | Policy 2: HiBS domestic and SME Delivery Schemes:
|
Key policy |
Policy 11a: Expanded £1.8bn HIBS Social Housing Decarbonisation funding over the next parliament. That includes
|
Key policy |
Table 5‑8b. Policy packages for the Buildings sector – Package B2 and other policies
| Policy Package | Policy | Categorisation |
|---|---|---|
| B2 Energy efficiency measures (not SG funded) |
Policy 9: Re-introduce revised regulations to the Scottish Parliament requiring mandatory minimum energy efficiency standards for the Private Rented Sector, to come into force from 2022. | Key policy |
| Policy 5: Energy Efficiency Standard for Social Housing: will be met by social landlords by 2020. | Key policy | |
| Policy 24: Work with social landlords to bring forward the review of the existing Energy Efficiency Standard for Social Housing (EESSH2) with a view to strengthening and realigning the standard with net-zero requirements. | Supporting measure | |
| Individual policy Energy Company Obligation |
Policy 1: Energy Company Obligation (ECO) requires obligated energy supply companies to deliver energy efficiency measures in homes – mainly insulation-based measures and boiler replacements. | Key policy |
| Individual policy New Build Zero Emissions from Heat Standard |
Policy 6: 2024 New Build Zero Emissions from Heat Standard: requiring new buildings to have zero emissions heating systems. | Key policy |
| Individual policy Heat in Buildings Regulation |
Policy 8: Heat in Buildings regulation: Put in place regulation to increase uptake of zero emissions heating systems and improve energy efficiency standards across all tenures, prioritising the raising of standards for households living in fuel poverty. | Key policy |
| Individual policy Scottish Green Public Sector Estate Scheme |
Policy 11c: £200m Scottish Green Public Sector Estate Scheme | Key policy |
| Individual policy The Renewable Heat Incentive |
Policy 13: The Renewable Heat Incentive (RHI) - a GB-wide scheme created by the UK Government (with the agreement of the Scottish Government). UK Government is extending both the domestic and non-domestic RHI out to 2022. | Key policy |
| Policy Package | Policy | Categorisation |
|---|---|---|
| Individual policy (Phase 1) Decarbonise non-domestic buildings |
Policy 21: Assessment of Energy Performance and Emissions Regulations (Non-Domestic Buildings). The Assessment of Energy Performance of Non-domestic Buildings (Scotland) Regulations 2016 require assessment of the energy performance and emissions of larger non-domestic buildings (those over 1,000 m²). Note that, through discussions with the Scottish Government, it was agreed to model this as 'Decarbonise the equivalent of 50,000 non-domestic buildings' | Key policy (Replaced in Phase 2 by the targets below) |
| BX2 (Phase 2) Decarbonise non-domestic buildings |
Target: Reduce service sector fossil fuel heat demand to 5,000 GWh by 2030 | Key target |
| Target: Reduce emissions intensity of non-domestic buildings (tonnes of CO2e per GVA) by 20% by 2025 and 30% by 2032 compared with 2015 | Overlapping/reinforcing | |
| BX1 (Phase 2) Blending biomethane and hydrogen into the gas network |
Target: Progress to 20% of Scottish gas demand accounted for by biomethane and hydrogen blended into the gas network by 2030 | Key target |
5.2.4 Variation across scenarios
Some of the measures that were modelled vary across scenarios, while others do not.
Policies that are associated with a fixed amount of funding, such as the HiBS domestic and SME Delivery Schemes or the Scottish Green Public Sector Estate Scheme, are assumed not to vary across scenarios.
Policies that represent an either/or option are also assumed not to vary. An example would be the New Build Heat Standard, which would require new buildings to use ZDEH. We have assumed that this would be implemented regardless of the level of economic growth or hydrogen availability.
However, where there are measures that could be adopted voluntarily by households, businesses, and the public sector, we have assumed that these would vary across the economic growth scenarios because that would impact the amount of money available to spend on such measures. Examples include uptake of retrofitting measures (as part of the EPC upgrades), or adoption of heat pumps (driven by the Heat in Buildings Regulation). We have assumed that in a high growth scenario, more people would choose to adopt these measures, so the rate of uptake is faster than in the central scenario. The opposite is true in the low growth scenario.
In Phase 1 we made the simplifying assumption that hydrogen would not be used to heat buildings. The Scottish Government's Hydrogen Action Plan states: "We do not consider that hydrogen will play a central role in the overall decarbonisation of domestic heat."[19] Therefore, there is no difference between the high and low hydrogen scenarios in Phase 1. The impact of blending hydrogen into the gas grid was modelled as part of Phase 2 under the high hydrogen availability scenario.
5.3 Emissions Projections
5.3.1 Phase 1 results
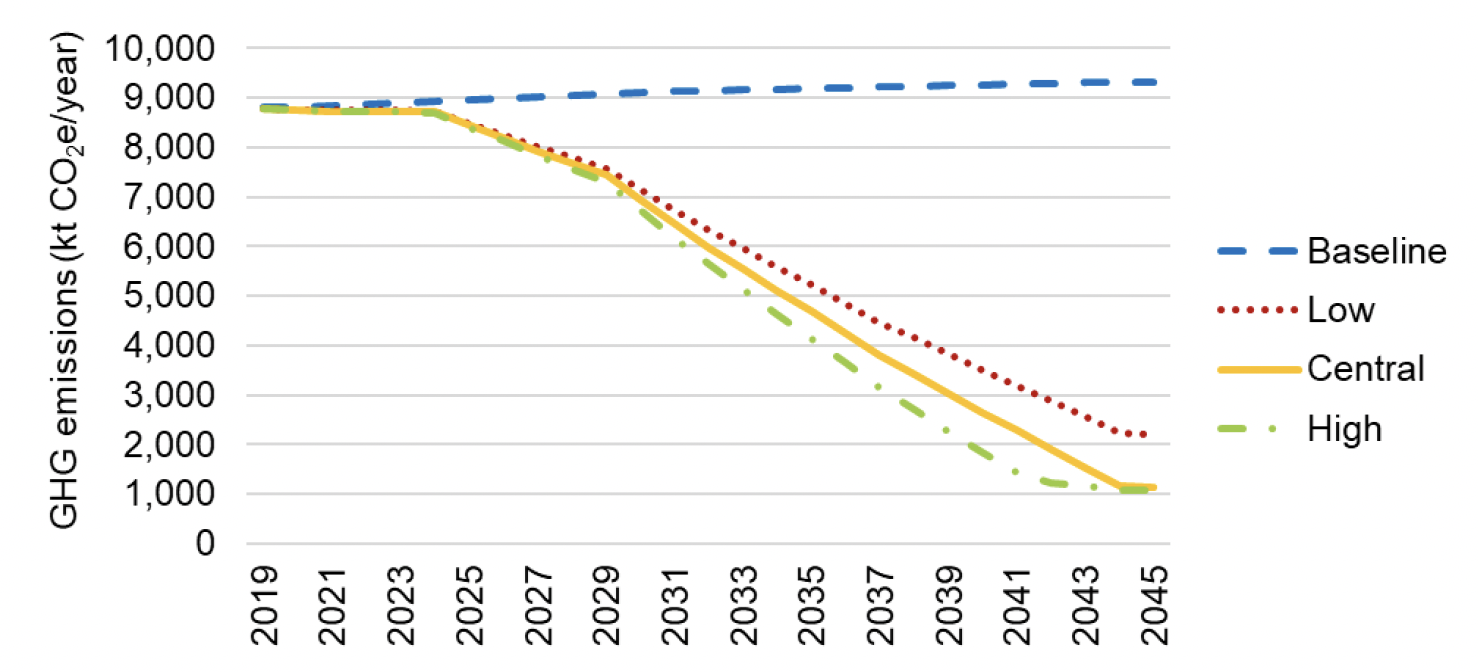
In the Baseline scenario, emissions show a small increase to 2045 due to new development and economic growth. In all other scenarios, there is a slow reduction in emissions in the mid to early 2020s, followed by an accelerated reduction later in the decade, but the most significant impacts occur from 2030 onwards due to the Heat in Buildings Regulation (more on this below).
Emissions reductions are driven by policies and funding schemes targeting retrofits and the installation of zero direct emissions heating in existing homes (e.g., HiBS domestic and SME Delivery Schemes, Energy Efficiency Standard for Social Housing, Private Rented Sector Minimum Energy Efficiency Standards, Heat in Buildings Regulation). In the high growth scenario, retrofitting rates are assumed to be higher, whereas the opposite is true in the low growth scenario.
The impact of tighter energy performance standards and zero direct emissions heating for new dwellings is relatively small, since (a) there are not many of them in comparison with the existing stock, and (b) they are already likely to be more energy efficient. Policies related to new buildings are best understood as mitigating the potential increase in emissions that would otherwise occur; understandably, they do not reduce existing sources of emissions.
By far the most impactful policy is the Heat in Buildings Regulation, which in this analysis is assumed to result in the near-total phaseout of fossil fuels in buildings. In the high growth scenario, we have assumed that this shift takes place more rapidly, whereas in the low growth scenario we have assumed that around 20% of buildings do not switch heating systems by 2045, resulting in a shortfall against the target. Note that the details of the Heat in Buildings Regulation have not yet been determined, so the actual impact of this policy is uncertain. At present, without details of the regulation, the emissions reductions presented here are considered to be highly optimistic, and effective implementation mechanisms will need to be identified to ensure that they are achieved.
In 2045 there would be some residual emissions from the building sector; these may include refrigerants and any wood or other fuels used as secondary heating.
The main GHG reductions come from changes in fuel use, in particular the phase-out of fossil fuels in favour of decarbonised electricity. This is highlighted on the graphs below. In the Baseline scenario, there is a small increase in energy use over time due to new development and economic growth. By comparison, in the central scenario, there is a near-total phase-out of fossil fuels due to the Heat in Buildings Regulation.
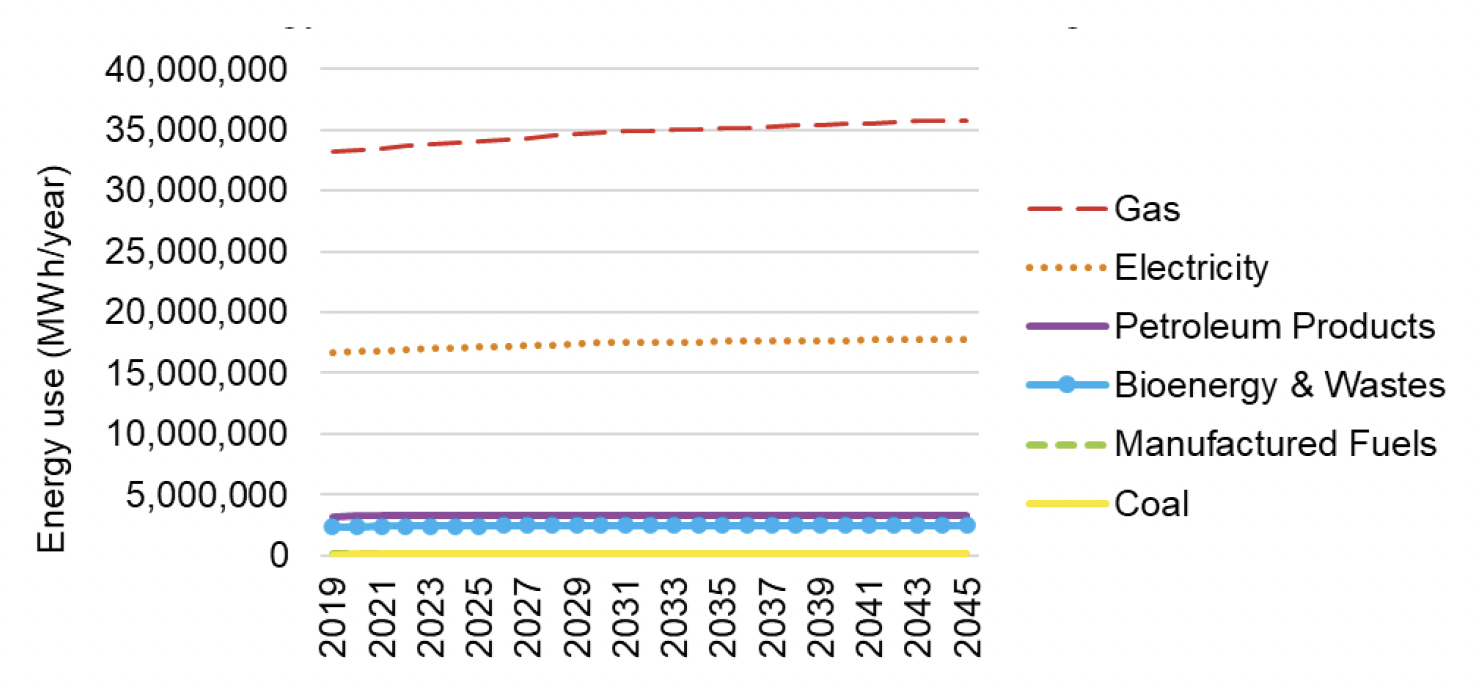
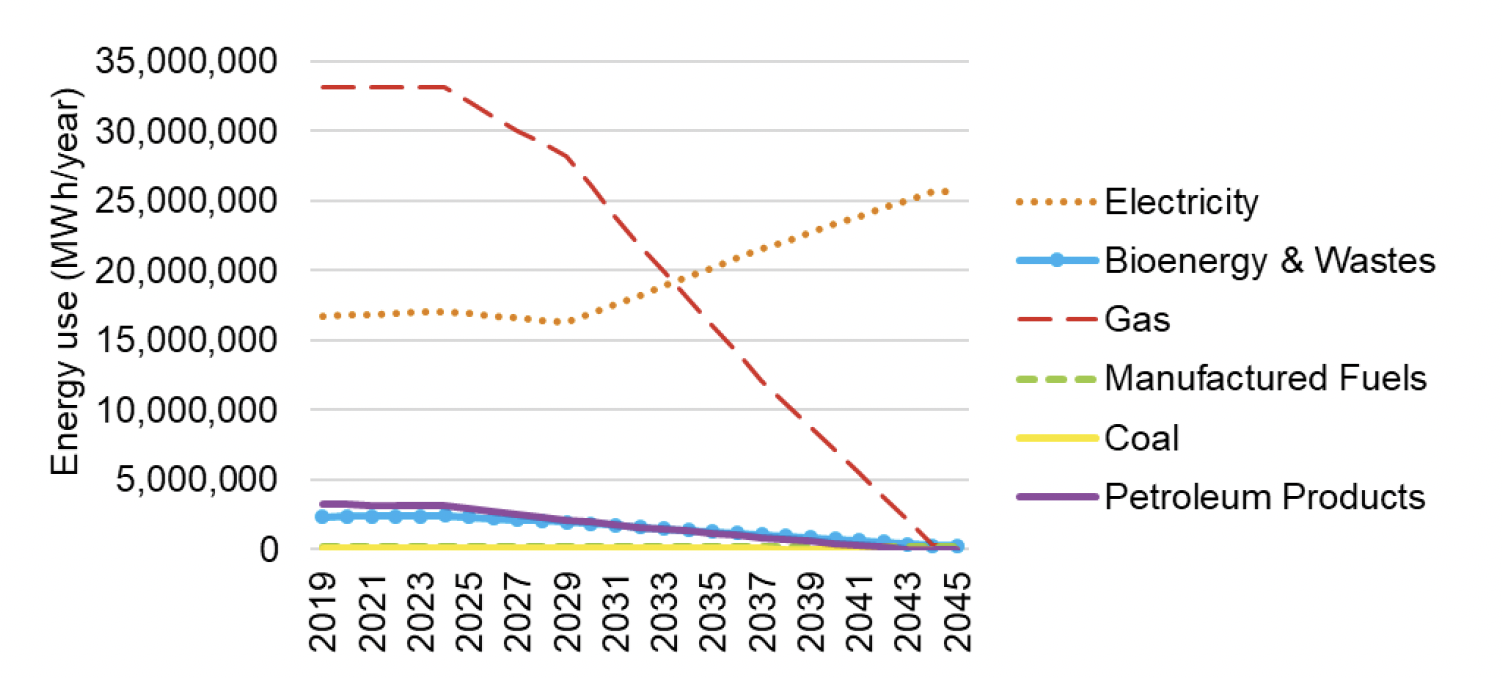
Among the scenarios modelled, the main difference in energy use and emissions is due to assumptions about faster or slower uptake of retrofitting measures and zero emissions heating systems, as explained in the 'Sensitivities' section below, so the graphs have not been duplicated here.
Note: Potential impact of targets and capital funding schemes related to heat networks.
Heat networks offer the potential to deliver GHG emissions reductions in several ways, examples of which include:
- Providing an opportunity to utilise waste heat - e.g., from waste treatment or other industrial processes
- Plant may operate more efficiently when there is a high and consistent heat load (although note that in some circumstances this may be offset by heat loss along the distribution network)
From a logistical standpoint, they can also facilitate the transition to lower emission heat sources, because if buildings are connected to a communal or district heat supply, then in principle it may be possible to switch one centralised system to a low or zero carbon heat source, which could be easier than replacing individual heating systems.
However, the actual energy and emissions impacts depend heavily on multiple factors. From a GHG emissions standpoint, one of the key questions is what heating systems and fuel types are currently in use, and what they are being replaced by. Furthermore, heat networks or communal heating systems may be installed in new developments, in which case there may be no impact at all on existing sources of GHG emissions, and instead the effects might be captured under the New Build Heat Standard (NBHS) for new buildings.
It is understood that, although the Scottish Government has set targets for the amount of heat (in TWh) that will be supplied by heat networks in future, there is currently no detail on exactly what types of heat networks would be delivered, which makes a detailed assessment impossible.
These issues notwithstanding, to provide some general context for the potential impact of this target (and the available funding that has been allocated towards it), we have provided some high-level estimates.
Based on the assumptions set out in Appendix 3, achieving the 6 TWh target could reduce emissions by around 3% compared with a 2020 baseline of 40 MtCO2e. The £300m in heat network funding could potentially contribute towards up to 20% of that target being met, leading to emissions reductions that are roughly equivalent to 0.2%-0.6% of total territorial emissions in 2020. This is likely to be an overestimate because it assumes that the heat networks will all use a zero direct emissions heat source. However, there is a much broader set of policies that will help to support and enable the development of heat networks in Scotland which have not been quantified.
These estimates are intended only to provide general context for the potential scale and direction of impacts from these policies, on the assumption that more detailed assessments would need to be carried out in future.
5.3.2 Phase 2 results
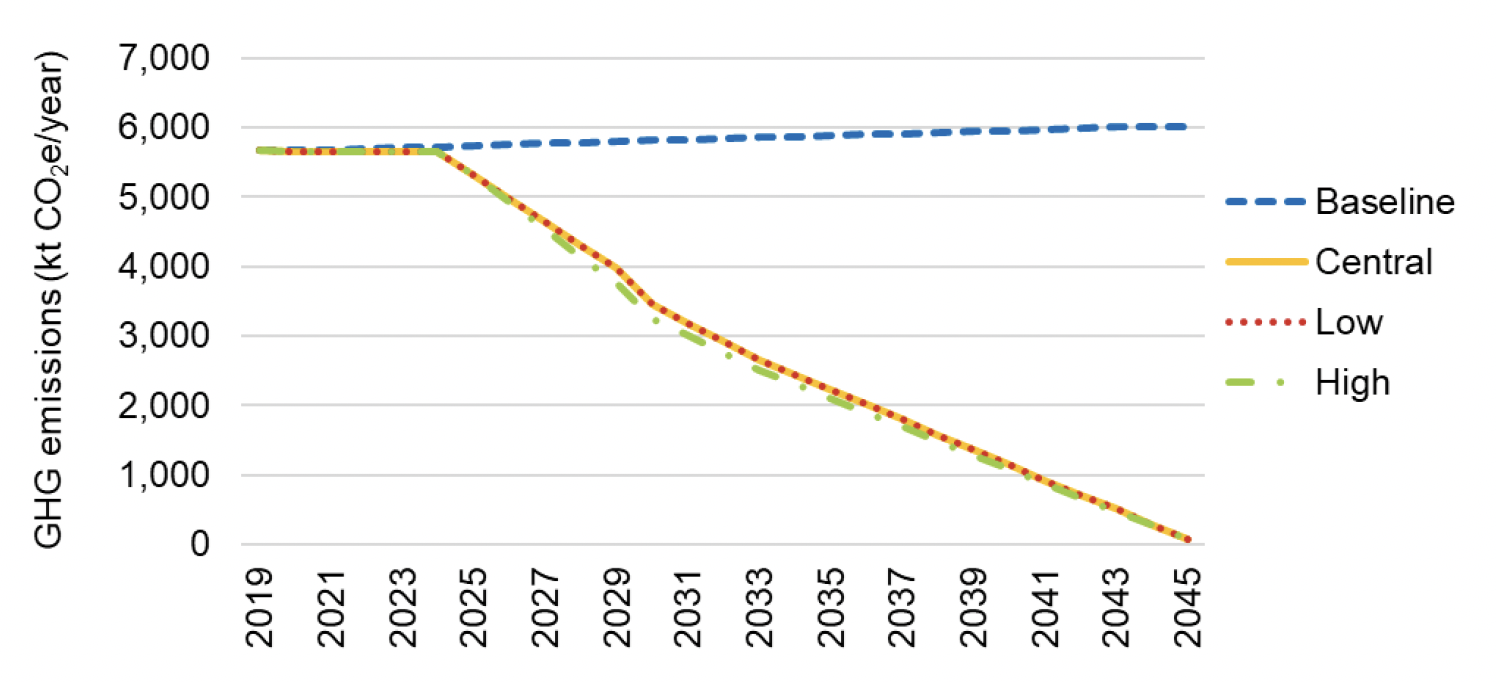
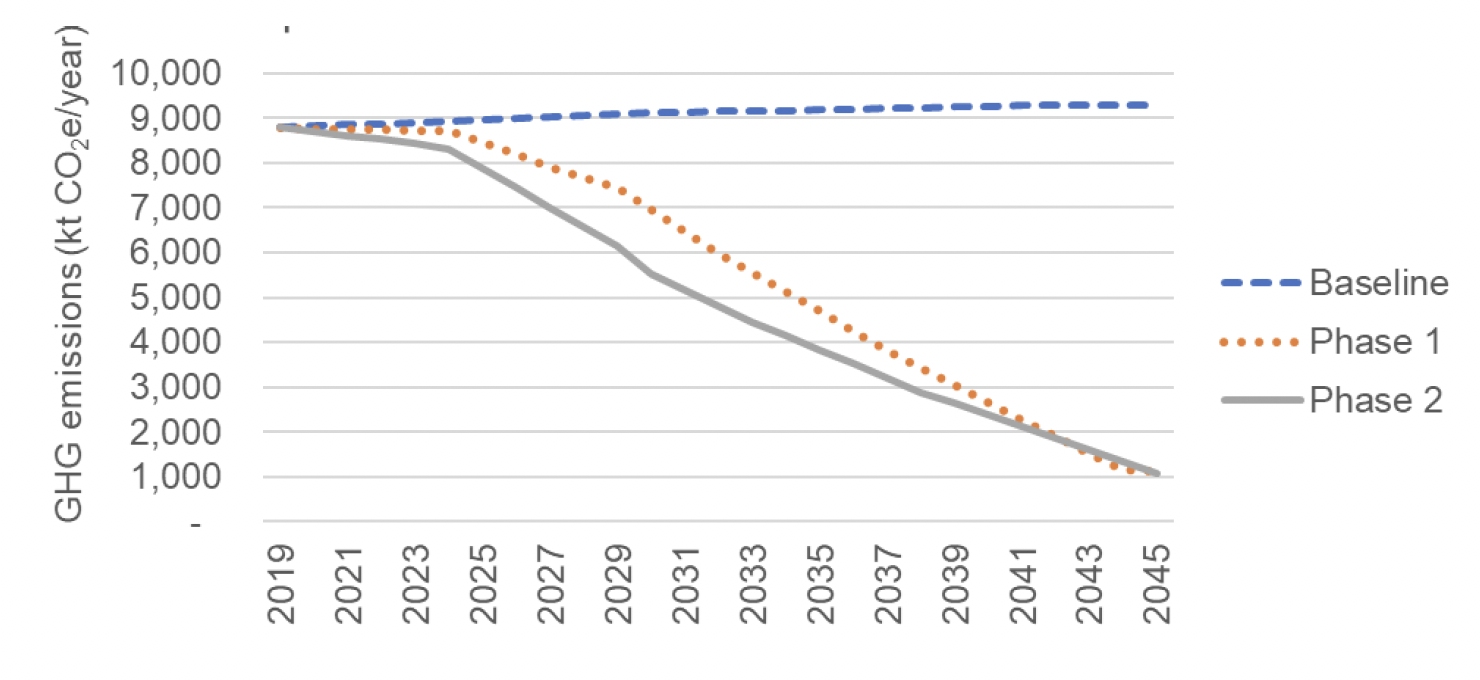
Results for the Buildings sector as a whole are shown below. In the Baseline scenario, emissions from buildings rise by 5-6% by 2045, from 8,802 ktCO2e in 2019 to 9,303 ktCO2e in 2045. In domestic buildings, the driver for this is population growth and an increase in the number of households, which is taken as a proxy for the number of new buildings constructed in that time period. In non-domestic buildings, the driver is economic growth, which is assumed to result in higher energy use, particularly in the commercial sector.
In all other scenarios, emissions from buildings fall by c. 84% by 2045.[20] The only difference between the decarbonisation scenarios is that cumulative emissions from the High Hydrogen scenario would be slightly lower than the others, due to the use of a gas/hydrogen blend as an interim decarbonisation measure. This is shown on the graph below. Note, "High" and "Low" in this instance refer to the High Hydrogen and Low Hydrogen scenarios.
As in Phase 1, in 2045 there would be some residual emissions from the building sector; these may include refrigerants and any wood or other fuels used as secondary heating.
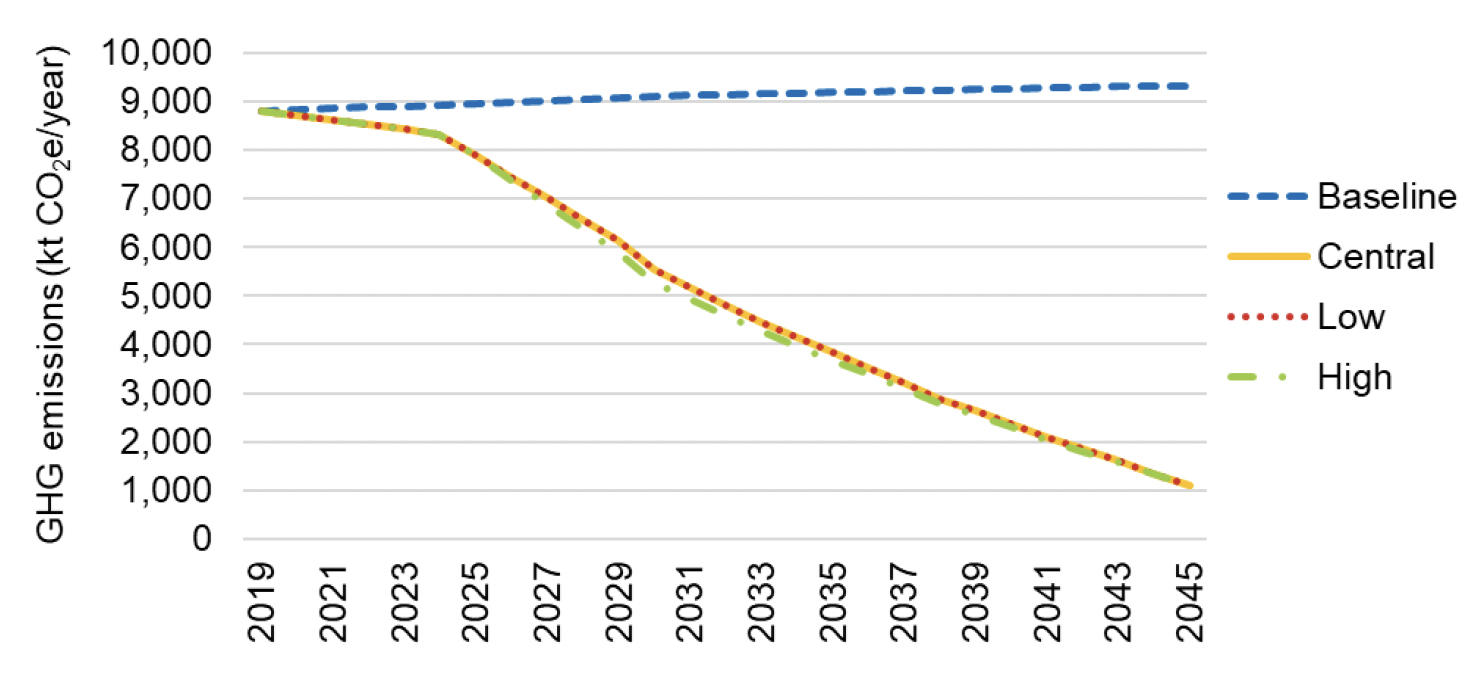
Note: The results from the three growth scenarios are visibly almost indistinguishable from each other because of the small magnitude of differences between them.
In 2045 there would be some residual emissions from the Buildings sector; these may include refrigerants and any wood or other fuels used as secondary heating.
Further details relating to domestic and non-domestic buildings in Phase 2 are provided below.
Domestic buildings
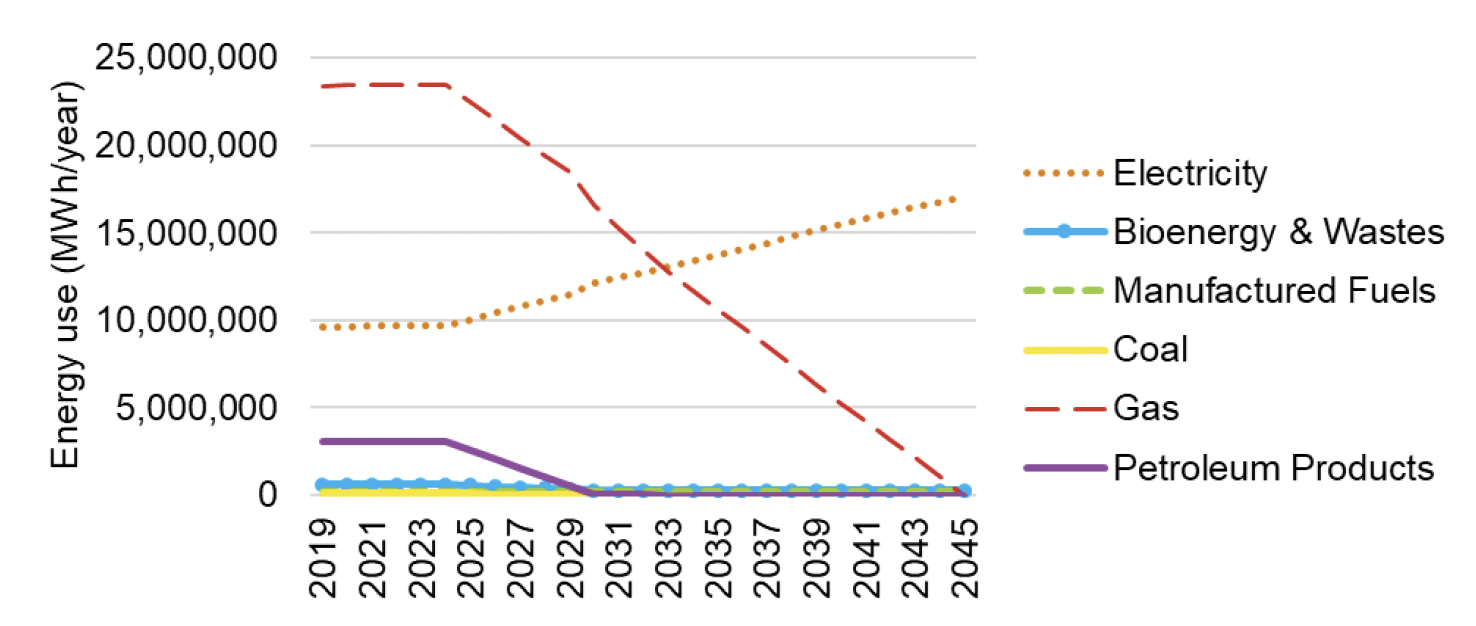
Results for the domestic sector are shown below. Overall, emissions from the domestic sub-sector are shown to reduce to almost zero by 2045, which is due to the complete phase-out of fossil fuels and a switch to ZDEH.
Note: The results from the three growth scenarios are visibly almost indistinguishable from each other because of the small magnitude of differences between them.
The initial slow reduction from 2019-2025 is due to energy efficiency upgrades (as noted previously, EPC ratings have been used as a proxy). This is followed by a steeper reduction in emissions in the second half of the decade as the Heat in Buildings regulations take effect. In combination, by 2030 these factors result in a c. 40% reduction in emissions from domestic buildings for all scenarios except the High Hydrogen scenario. In the High Hydrogen scenario, the reduction by 2030 is slightly higher, at 43% (however, since hydrogen is understood to be an interim measure prior to the widespread adoption of heat pumps, the results converge by 2045). From the 2030s onwards, the speed of decarbonisation is slightly slower as it is assumed that heating systems will be replaced at a rate closer to the natural replacement cycle. By 2045 there are very small residual emissions from the use of wood and other fuels used as secondary heating (e.g. domestic fireplaces).
The chart below illustrates how the above targets result in changes in energy use in dwellings.
The trends in energy use and emissions are similar for each domestic sub-sector, with small variations due to the different EPC rating targets and associated backstop dates.
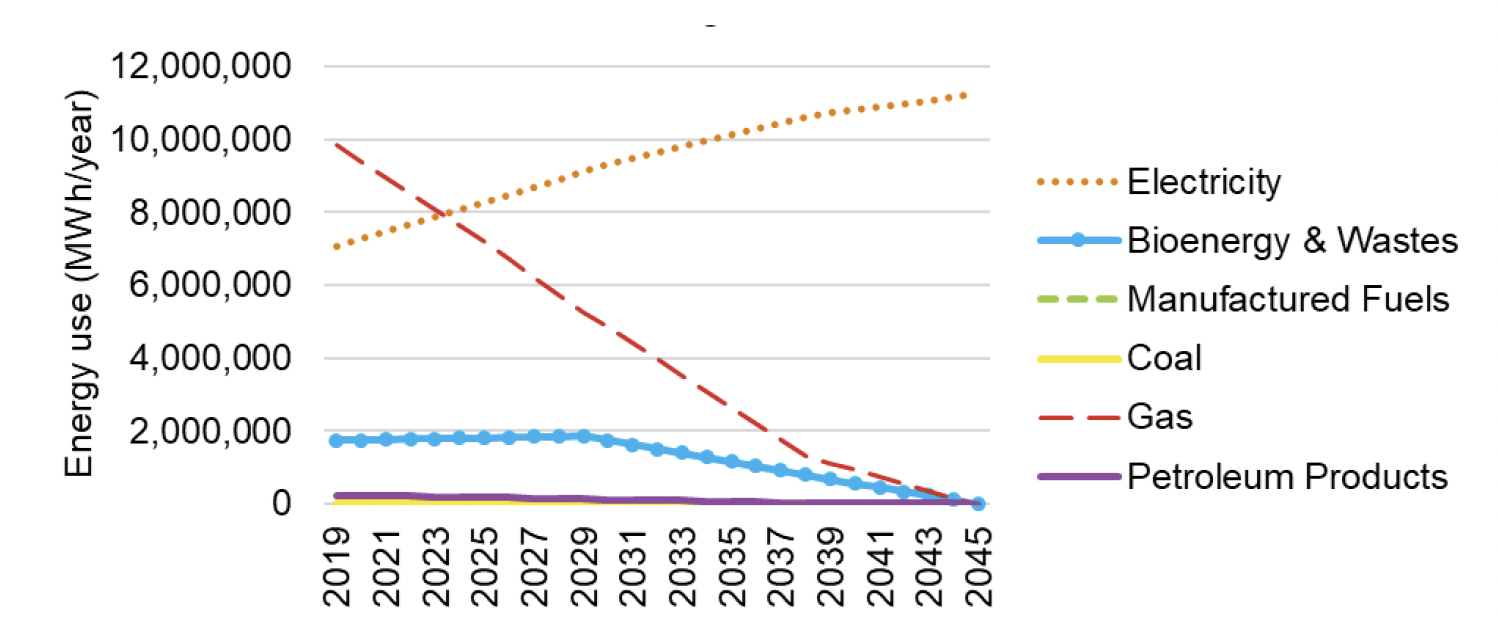
Non-domestic buildings
Results for the non-domestic buildings are shown below. The changes shown here are solely due to the reduction in fossil fuel consumption, which results in emissions decreasing by c. 45% by 2030 in most scenarios (c. 48% in the High Hydrogen scenario). This would achieve – and indeed exceed – the emissions intensity reduction target as well. By 2045, emissions from heat and electricity use in these buildings would reach net zero if all buildings switched to ZDEH, which has been modelled in the below graph.
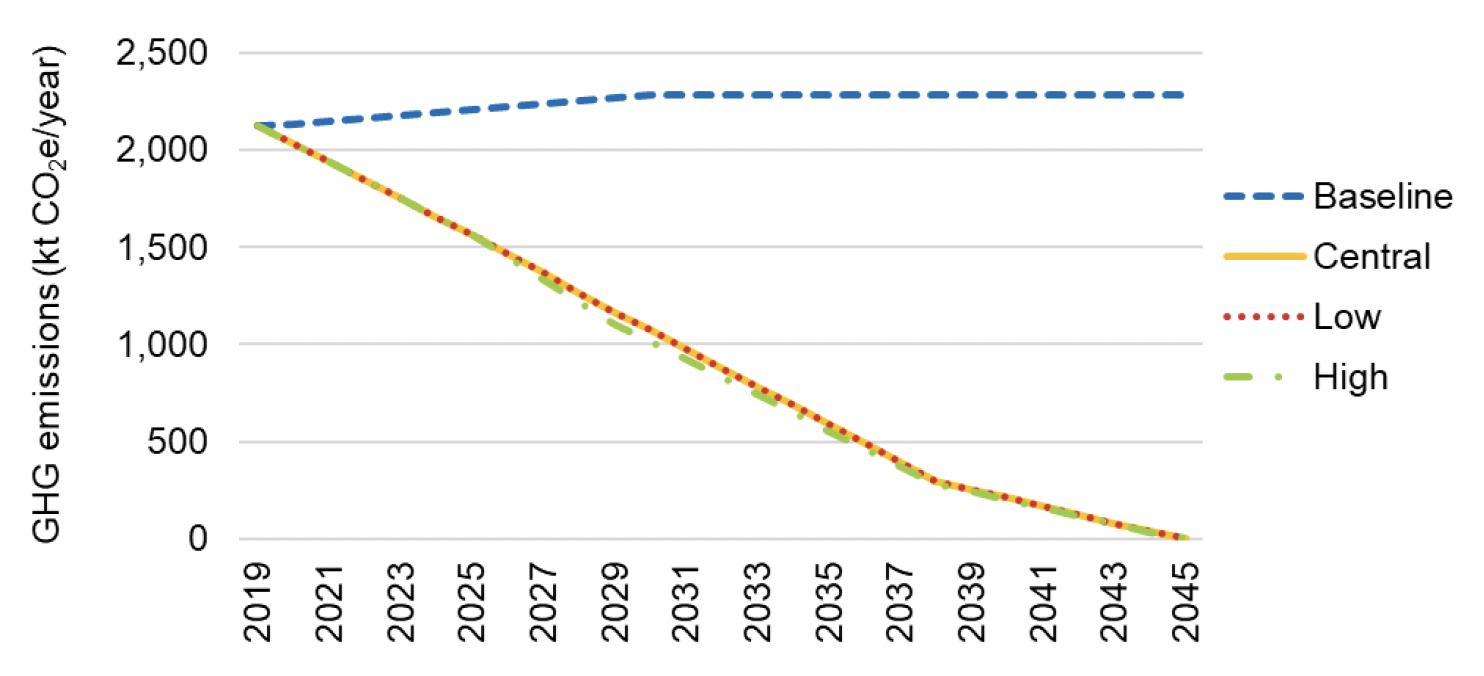
Note: The results from the three growth scenarios are visibly almost indistinguishable from each other because of the small magnitude of differences between them.
This modelling assumes that the fossil fuel heat demand will shift to some other zero direct emissions energy vector such as electricity. However, the wording of the outcomes and targets does not specify which alternative fuel, technology, or other measures would be used to reduce fossil fuel heat demand to this extent, and in principle this could be achieved through different means.
Concluding points
Overall, the Phase 2 results support the findings of the Phase 1 modelling, which found that the most significant impacts are achieved from phasing out fossil fuel consumption in favour of zero direct emissions energy sources. The key mechanism for achieving this is through regulations aimed at replacing fossil fuel heating systems. The modelling also shows that cumulative emissions in the timeframe to 2045 depend not only on which mitigation measures are adopted, but also when they are adopted. For example, cumulative emissions in the domestic sector would be higher if the target of decarbonising more than 1 million homes by 2030 was reduced, postponed, or abandoned in favour of simply requiring all replacement heating systems to be ZDEH from the 2030s onwards.
5.3.3 Comparison of Phases 1 & 2
Emissions projections from the Buildings sector for all scenarios in Phases 1 and 2 of the project are provided below in Table 5‑10.
| Phase | Scenario | Emissions (ktCO2e/year) | ||||||
|---|---|---|---|---|---|---|---|---|
| 2019 | 2020 | 2025 | 2030 | 2035 | 2040 | 2045 | ||
| n/a | Baseline | 8,802 | 8,820 | 8,967 | 9,114 | 9,186 | 9,259 | 9,303 |
| 1 | Central Growth | 8,772 | 8,748 | 8,448 | 6,951 | 4,678 | 2,660 | 1,140 |
| High Growth | 8,769 | 8,743 | 8,406 | 6,745 | 4,142 | 1,833 | 1,084 | |
| Low Growth | 8,774 | 8,753 | 8,491 | 7,157 | 5,213 | 3,509 | 2,209 | |
| High Hydrogen | 8,772 | 8,748 | 8,448 | 6,951 | 4,678 | 2,660 | 1,140 | |
| Low Hydrogen | 8,772 | 8,748 | 8,448 | 6,951 | 4,678 | 2,660 | 1,140 | |
| 2 | Central Growth | 8,802 | 8,703 | 7,887 | 5,539 | 3,835 | 2,369 | 1,086 |
| High Growth | 8,802 | 8,703 | 7,887 | 5,539 | 3,835 | 2,369 | 1,086 | |
| Low Growth | 8,802 | 8,703 | 7,887 | 5,539 | 3,835 | 2,369 | 1,086 | |
| High Hydrogen | 8,802 | 8,703 | 7,887 | 5,282 | 3,676 | 2,294 | 1,086 | |
| Low Hydrogen | 8,802 | 8,703 | 7,887 | 5,539 | 3,835 | 2,369 | 1,086 | |
5.3.4 Emissions reduction by policy package (2032) – Phase 1 & 2
A comparison between the projected annual emission reduction by 2032 is provided below.
| Policy Package | Emissions reductions by 2032 (ktCO2e) | |||||||||
|---|---|---|---|---|---|---|---|---|---|---|
| Phase 1 | Phase 2 | |||||||||
| Central Growth | High Growth | Low Growth | High Hydrogen | Low Hydrogen | Central Growth | High Growth | Low Growth | High Hydrogen | Low Hydrogen | |
| B1 | -56 | -56 | -56 | -56 | -56 | 0 | 0 | 0 | 0 | 0 |
| B2 | -167 | -201 | -134 | -167 | -167 | 0 | 0 | 0 | 0 | 0 |
| BX1 (Phase 2) | 0 | 0 | 0 | 0 | 0 | 0 | 0 | 0 | -414 | 0 |
| BX2 (Phase 2) | 0 | 0 | 0 | 0 | 0 | -1,113 | -1,113 | -1,113 | -1,048 | -1,113 |
| Individual Policy (Policy 6) | -119 | -119 | -119 | -119 | -119 | -138 | -138 | -138 | -138 | -138 |
| Individual Policy (Policy 8) | -1,767 | -1,988 | -1,547 | -1,767 | -1,767 | -2,485 | -2,485 | -2,485 | -2,381 | -2,485 |
| Individual Policy (Policy 1) | -30 | -30 | -30 | -30 | -30 | 0 | 0 | 0 | 0 | 0 |
| Individual Policy (Policy 2) | -26 | -31 | -20 | -26 | -26 | 0 | 0 | 0 | 0 | 0 |
| Individual Policy (Policy 9) | -458 | -550 | -367 | -458 | -458 | -597 | -597 | -597 | -566 | -597 |
| Individual Policy (Policy 13) | -39 | -39 | -39 | -39 | -39 | 0 | 0 | 0 | 0 | 0 |
| Individual Policy (Policy 21) | -496 | -496 | -496 | -496 | -496 | 0 | 0 | 0 | 0 | 0 |
| Individual Policy (Policy 11c) | -4 | -4 | -4 | -4 | -4 | 0 | 0 | 0 | 0 | 0 |
| Total tables 5.7a and 5.7b | -3,163 | -3,513 | -2,813 | -3,163 | -3,163 | -4,332 | -4,332 | -4,332 | -4,548 | -4,332 |
5.4 Uncertainties
A formal uncertainty analysis has not been carried out, but some commentary on key issues and the potential scale of uncertainty associated with these estimates is provided below.
- Disaggregation of energy use by sub-sector: For domestic buildings, energy use has been disaggregated based on split of tenancies, which assumes that all tenancies consume the same amount of fuel on average. In practice, this varies by tenancy. This would have a relatively small impact on the results for each domestic sub-sector but will not impact the results for the domestic buildings sector as a whole. For non-domestic buildings, the disaggregation of energy use is more uncertain. It is difficult to estimate the impact this would have at a sub-sector level, but again the impact is likely to be lower when considering non-domestic buildings as a whole.
- Impact of growth in the Baseline scenario: Assuming that new buildings will be highly efficient and fitted with zero direct emission heating systems, variation in new development rates would have minimal impact on the results. However, year-on-year variation associated with economic changes, energy prices, or weather could impact results by roughly ±10%.
- Impact of capital funding schemes, ECO, RHI, etc.: The actual energy savings from these types of installations varies significantly between properties, potentially by ±50%. In some instances, occupants may actually use more energy following retrofitting measures (known as the take-back effect). Furthermore, historically it has been the case that not all available funding is actually deployed, so the impact on energy use may have been overestimated on that basis. However, the overall impact of these schemes is small, so this will not have a major impact on the overall results.
- Impact of retrofitting and minimum EPC rating targets: The scale of improvement from retrofitting has been modelled as 13-15% reduction in space heating demand depending on the sub-sector. This assumes that a proportion of buildings do not meet the minimum EPC rating target. Increasing the proportion that do meet the target could result in reductions of up to 20%. However, a conservative assumption has been made to reflect uncertainties in the funding and regulatory approach. In a worst-case scenario, where there continues to be a small uptake of only the most cost-effective measures, the reduction in space heating demand could be much lower than what has been modelled.
- Impact of switching to zero direct emission heating systems: There are three significant sources of uncertainty, all of which could have a major impact on the emissions projections for buildings since this is the key sensitivity in the model (see 'Sensitivities' section below).
- The assumed rate of uptake of zero direct emission heating systems – If this is lower than anticipated, that would have a significant impact on the total results for this sector. Recognising that it is not yet clear how the Heat in Buildings Regulation would be implemented or enforced, uptake could be – in theory, based on current rates of heat pump installations – 90% lower than anticipated. (It cannot be higher because we have assumed that all properties would switch by 2045 at the latest.)
- Which heating fuels are displaced, and what alternative energy sources they are displaced by – Although not necessarily captured in the model due to the boundary of the analysis, it is worth acknowledging that some ZDEH systems may still result in GHG emissions elsewhere in the energy system. Depending on the source of electricity, hydrogen, biodiesel, etc., there could be emissions that are not reflected in the current model, which assumes all fossil fuels in buildings will switch to decarbonised electricity.[21]
- The relative efficiency of the original heating systems versus the new heating systems – This impacts energy demand, although it does not necessarily impact emissions if one assumes that electricity is zero carbon. The scale of uncertainty here is considerable. For example, direct electric heating could be classed as a zero direct emissions heating system, but would use roughly three times as much electricity as a heat pump with a COP of 3.0. So, the projected energy demands in buildings by 2045 could be up to 300% of the projected figure in the model. Potentially, this could be even higher if green hydrogen was used to heat buildings, because it uses much more renewable electricity due to lower conversion efficiencies.
The following points only apply to the modelling carried out under Phase 2:
- Blending "green gas" into the gas network: At this stage, the blend of hydrogen and biomethane is uncertain, as is the method of production of hydrogen. These would both have an impact on the total emissions reduction at the whole-systems level that is achieved through this measure. For example, if the hydrogen is not "green hydrogen", the emissions reduction that is achieved through this measure would decrease.
- Reducing fossil fuel consumption in the service sector: As stated previously, the reduction has been modelled based on an assumed switch to heat pumps, but the wording of the target is not specific and in principle this could be achieved through other means. The modelled GHG emissions would not change significantly. However, the modelled energy use in the service sector is uncertain.
5.5 Sensitivities
The projected growth in domestic and non-domestic energy use in the Baseline scenario is small, although not insignificant considering that any increase in emissions will make net zero harder to achieve. By 2045, this would increase emissions within this sector by around 6% relative to 2019.
The impact of the capital funding schemes is small, reflecting that they are targeted at a small number of households with the aim of addressing fuel poverty and achieving emissions reductions, and mostly serve to mitigate the increase in emissions from buildings that would otherwise occur due to new development and economic growth. This is because the number of measures installed is very low compared with the total number of buildings. Historically, many of these schemes have also included upgrades that only have a small impact on energy consumption, such as replacing old boilers with new ones, or installing smart meters.
If and when the building stock as a whole is retrofitted to higher energy efficiency standards, this would have a larger impact. (As noted previously, we have used EPC ratings as a proxy for fabric efficiency, recognising that there are limitations to this approach.) Depending on the sub-sector in question, this would reduce heating demands within each sub-sector by roughly 13-15%.
By far the most impactful policy from an energy demand and emissions standpoint is the Heat in Buildings Regulation, which is assumed to result in the near-total phase-out of fossil fuel use in the Buildings sector.[22] Within this, the key variables from a whole-systems perspective are (1) the difference in carbon intensity of fossil fuels versus grid electricity and (2) the difference in efficiency between boilers, direct electric heating, and heat pumps. In principle, the same level of overall territorial emissions reduction could be achieved by using electric boilers or direct electric heating systems, assuming that all buildings still switch to zero carbon electricity; however, the heat pump performance is what drives the biggest reduction in energy demand for the sector.
Contact
Email: Edward.Mchardy@gov.scot
There is a problem
Thanks for your feedback