Greenhouse gas emissions projections: phase 1 and phase 2 modelling results
Analysis undertaken by Ricardo-AEA for the Scottish Government to provide an estimated projection of Scottish emissions from 2019 to 2045 which capture announced Scottish and UK policies.
9. Waste sector
9.1 Sector Overview
9.1.1 Sector Background
Scotland has set ambitious emissions reduction targets in the waste and resources sector. Emissions in the Waste sector reached 1.5 MtCO2e in Scotland in 2019, which is a marked reduction from 5.8 MtCO2e in 1990.[51] With the aim to reduce these emissions to 0.9 million tonnes by 2025, and 0.7 million tonnes by 2030, Scotland faces significant challenges to meet its targets. The Climate Change Plan update (CCPu)[52] sets out four policy outcomes for the Waste sector and sets the following key commitments by 2025:
- End landfilling of biodegradable municipal waste
- Reduce the percentage of all waste sent to landfill to 5% and recycle 70% of all waste
- Double the number of landfill gas capture sites in Scotland that undertake investigative or development work (from 12 to 24 sites)
- Reduce food waste by 33% from the 2013 baseline
The first annual monitoring report against the CCPu was published in March 2021. While this report suggests progress is being made on outcomes (reduction in landfilled waste, biodegradable municipal waste to landfill), it concluded that it was ultimately too early to evaluate whether the Plan is on track to achieve the key policy outcomes for the Waste sector.
9.1.2 Subsectors Considered
The Waste sector was disaggregated into the following subsectors:
- Landfill
- Anaerobic digestion (AD)
- Composting
- Sewage & Wastewater
- (Incineration)
The CCPu mainly focuses on landfill, since this source is responsible for the largest contribution to the GHG emissions from the Waste sector, followed by wastewater treatment. Since all incineration of waste in Scotland is with energy recovery, emissions from this source are reported in the energy sector and have not been modelled in this sector.
9.1.3 Data Sources
The main data sources used to undertake the assessment of the Waste sector are detailed in Table 9‑1 below.
| Purpose | Data used | Comment |
|---|---|---|
| GHG inventory for Scotland | UK National Atmospheric Emissions Inventory (UK NAEI) | GHG inventory for Scotland needed to estimate impacts of policies on emissions. |
| Energy consumption in Scotland | UK National Atmospheric Emissions Inventory (UK NAEI) | Energy consumption by sub-sector in Scotland needed to estimate impacts of policies on energy use. |
| Total waste generated | SEPA 2018 | Waste from all sources in Scotland – summary data 2018 |
| Waste landfilled | SEPA 2019 | Total amount of landfilled waste and biodegradable landfilled waste |
Note that some of the data sources have been updated since the analysis in this report was originally undertaken.
9.1.4 Underlying Drivers of Energy & Emissions
The main underlying driver of emissions in the Waste sector is the amount of waste generated and treated. Different waste streams and treatment methods have different impacts on emissions. The disposal of solid waste to landfill is the main source of methane generated for this sector. Methane is a potent greenhouse gas with a global warming potential (GWP) 28 times higher than that of CO2; it accounts for the majority of GHG emissions from the Waste sector. Therefore, the amount of biodegradable waste, the fraction responsible for generating methane, and the total amount of landfilled waste are the main underlying drivers of growth in energy use and emissions in the Waste sector. With regards to wastewater treatment (the second largest source of emissions for the sector), the main underlying drivers of growth in energy use and emissions are population and GVA (Gross Value Added). The amount of domestic wastewater is likely to increase in line with population while the amount of industrial wastewater may be linked to economic growth, measured by GVA. Energy consumption in the Waste sector is negligible in comparison to total national energy consumption.
When estimating the impact of policy measures on emission generation and energy use, the following assumptions were made:
- 4% growth in the amount of biological waste treated via anaerobic digestion based on the activity data from the period 2016-2020
- 0% growth in the amount of biological waste treated via composting based on the activity data from the period 2016-2020
- 1% growth for domestic wastewater based on emissions from the period 2016-2020
- 0% growth for industrial wastewater on emissions from the period 2016-2020
Since production of methane from the disposal of solid waste to landfills can continue for many years after their closure, this source needs to be modelled separately. A modified version of MELMod, the model used to calculate methane generation in the UK GHG inventory, was run to estimate the impact of reducing and eventually banning the disposal of biodegradable waste. Methane emitted to the atmosphere is then calculated subtracting the total amount of methane collected (total of methane utilised to produce energy and methane flared) and the methane oxidised in the landfill cover from the total amount of methane generated. Since utilised and flared methane depends on several variables difficult to model, the following assumptions were made:
- The 2016-2020 average collection efficiency of 63% was used to estimate the amount of methane collected from the methane generated and use to calculate the methane emitted.
- A conservative approach was taken to assume that the amount of flared methane, as calculated above, already included the contribution from the additional landfill gas flared from closed sites, which cannot be estimated at the moment.
9.2 Policy Measures and Outcomes Modelled
9.2.1 Phase 1 – Policy Measures
For the Waste sector, there were 16 policies/proposals to be assessed. Two proposals were deemed unquantifiable (especially those related to reduce waste and establish a more circular economy), due to a lack of data on how to quantify their impact and consequently incorporate them in the model for the GHG projections. These were excluded from the assessment.
Due to a lack of available data, it was not possible to assess some policies together (to ensure interactions between similar policies/proposals were captured) despite the fact they target similar outcomes. For example, the policies addressing landfilling of biodegradable municipal waste and reducing food waste have a combined effect on reducing methane generation from landfilled waste, but data for household and non-household food waste is available only for 2018.
Table 9‑2 below shows the packaging of policies into key themes, and the quantifiable targets informing the assessment. Reducing biodegradable waste to landfill (including historical trend) is considered the main driver for reducing Waste Management sector emissions.
| Theme | Quantifiable targets | Relevant policies / strategies / actions |
|---|---|---|
| Reduction in biodegradable waste sent to landfill | Overall target: End landfilling of biodegradable municipal waste by 2025. Related targets:
|
|
| Reduction in food waste | Overall target: reduce food waste by 33% from the 2013 baseline by 2025 |
|
| Reduction in emissions from closed landfill sites | N/A – no quantifiable targets: 12 closed sites have been identified to capture landfill gas Note: the amount of flared landfill gas depends on several variables, and it is expected to decrease. Additional information on the sites is required to estimate quantifiable targets |
|
9.2.2 Phase 2 – Outcomes
Through discussion with the Scottish Government, it was agreed that no further modelling would be undertaken for the Waste sector in Phase 2.
As is the case for other sectors, it is noted that further potential measures may be brought forward that could impact on emissions from the Waste sector which have not been included in this analysis. For example, the Food Waste Reduction Action Plan is being reviewed at the time of writing (April 2023) which may result in revised targets. The Scottish Government has also developed and consulted on proposals for a Route Map to deliver on 2025 targets and set out proposals for a Circular Economy Bill.
9.2.3 Summary of Policy Packages
The table below indicates which policies were found to have the biggest potential impact within each package, which policies overlap with (or reinforce) each other, and which policies act as supporting measures.[53]
Policies related to the diversion of biodegradable waste from landfills, such as in policy package W1 and W3, are expected to have a greater impact on emission reduction for the waste sector. Banning of biodegradable municipal waste and introducing a mandatory national food waste reduction target will reduce emissions, since biodegradable waste is responsible for a large fraction of methane emissions, when disposed to landfill. Although capturing landfill gas has been an effective way to reduce methane emissions over the last decades, it is difficult to establish the impact of the proposal as described in package W2.
| Policy Package | Policy | Categorisation |
|---|---|---|
| W1 Reducing total (and biodegradable) waste to landfill |
Policy 1: End landfilling of biodegradable municipal waste by 2025 | Key policy |
| Policy 2: Reduce the percentage of all waste sent to landfill to 5% by 2025 | Key policy | |
| Policy 3: Recycle 70% of all waste by 2025 | Overlapping/reinforcing measure | |
| Policy 4: Developing a new route map to reduce waste and meet our waste and recycling targets for 2025 in a way that maximises their carbon savings potential | Supporting measure | |
| Policy 5: Developing a post-2025 route map for the waste and resources sector, identifying how the sector will contribute towards Scotland's journey towards net zero in the period to 2030 and beyond | Supporting measure | |
| Policy 6: Establishing a £70m fund to improve local authority recycling collection infrastructure | Overlapping/reinforcing measure | |
| Policy 7: In line with EU requirements, further promoting reuse and recycling ensure separate collection of textiles by 2025; and ensuring that bio-waste (e.g. garden waste), is either separated and recycled at source, or is collected separately and is not mixed with other types of waste by 2023 | Overlapping/reinforcing measure |
| Policy Package | Policy | Categorisation |
|---|---|---|
| W2 Landfill gas capture |
Proposal 1: Landfill gas capture on closed sites: in association with SEPA and the waste industry, double the number of landfill gas capture sites that undertake investigative or development work (from 12 to 24 sites) by 2025, in order to harness energy generated from landfill gas capture and maximise other circular economy opportunities. SEPA has already identified 12 sites for potential investigative work. | Key policy |
| W3 Food waste reduction |
Policy 1: Improving monitoring and infrastructure by considering a mandatory national food waste reduction target and mandatory reporting of Scotland's food surplus and waste by food businesses | Key policy |
| Policy 2: Consulting on the current rural exemption and food separation requirements for food waste collections, to help break down barriers to food waste reuse and recycling | Supporting measure | |
| Policy 3: Supporting leadership, innovation, effectiveness and efficiency in Scotland's public, private and hospitality sectors by expanding pilot programmes across the education sector and public sector buildings | Supporting measure | |
| Policy 4: Support the development and implementation of an NHS Scotland national action plan on food waste | Supporting measure | |
| Policy 5: Develop best practice guidance for public sector procurement teams to drive new ways of working and more transparent supply chains. | Supporting measure | |
| Policy 6: A sustained approach to public engagement and communications to enable the public to make changes in their choices and behaviours around food and food waste, in partnership with Zero Waste Scotland. | Supporting measure |
9.2.4 Variation across scenarios
It is assumed that the ban on biodegradable waste sent to landfill is unaffected by different economic growth scenarios. For the other measures, however, it is assumed that low economic growth will result in lower policy implementation, and high economic growth will result in greater policy achievement.
9.3 Emissions Projections
9.3.1 Phase 1 results
Total CO2e emissions from the Waste sector (shown in Figure 9‑1) are expected to decline from 1.5 MtCO2e in 2019 to around 0.70 MtCO2e in 2030, and around 0.33 MtCO2e in 2045. The remaining emissions would be mostly coming from wastewater and composting.
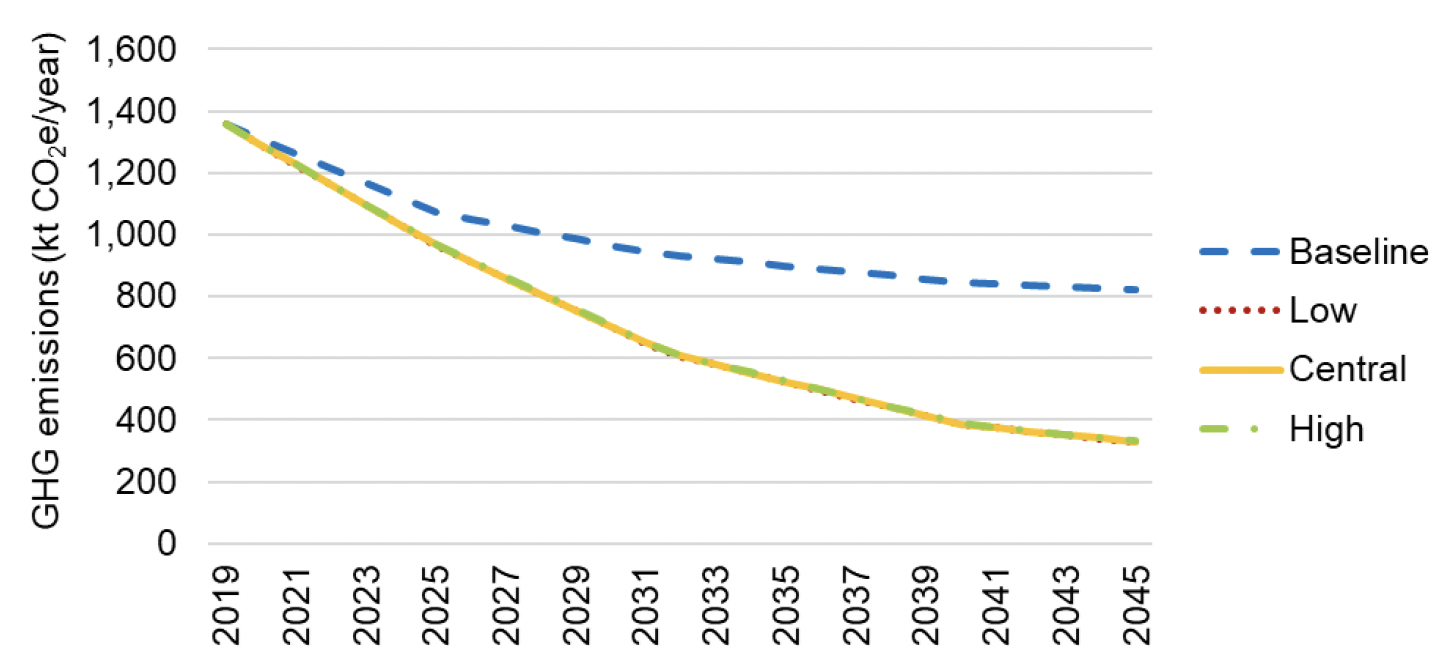
Note: The results from the three growth scenarios are visibly almost indistinguishable from each other because of the small magnitude of differences between them.
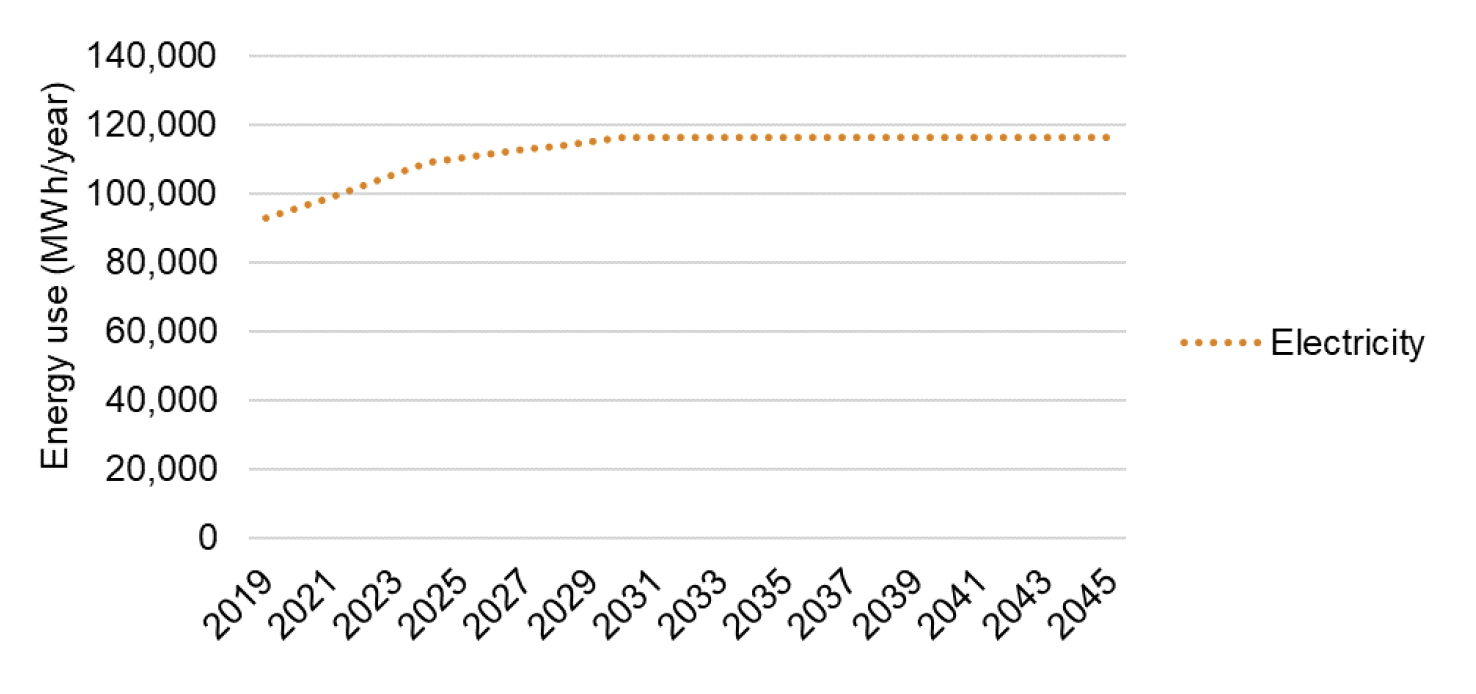
Energy used in the Waste sector is small compared to other sectors. The electricity consumption of this sector is expected to slightly increase and then plateau from 2030, as shown in Figure 9‑2.
9.3.2 Phase 2 results
As stated previously, no additional modelling was undertaken.
9.3.3 Comparison of Phases 1 & 2
The table below provides a comparison of the projected emissions for Phase 1 and Phase 2 (in ktCO2e) and by scenario.
| Phase | Scenario | Emissions (ktCO2e) | ||||||
|---|---|---|---|---|---|---|---|---|
| 2019 | 2020 | 2025 | 2030 | 2035 | 2040 | 2045 | ||
| n/a | Baseline | 1,357 | 1,309 | 1,071 | 966 | 900 | 845 | 822 |
| 1 | Central Growth | 1,358 | 1,293 | 966 | 704 | 525 | 388 | 329 |
| High Growth | 1,358 | 1,293 | 968 | 706 | 527 | 390 | 331 | |
| Low Growth | 1,358 | 1,292 | 965 | 702 | 523 | 385 | 327 | |
| 2 | Central Growth | 1,358 | 1,293 | 966 | 704 | 525 | 388 | 329 |
| High Growth | 1,358 | 1,293 | 968 | 706 | 527 | 390 | 331 | |
| Low Growth | 1,358 | 1,292 | 965 | 702 | 523 | 385 | 327 | |
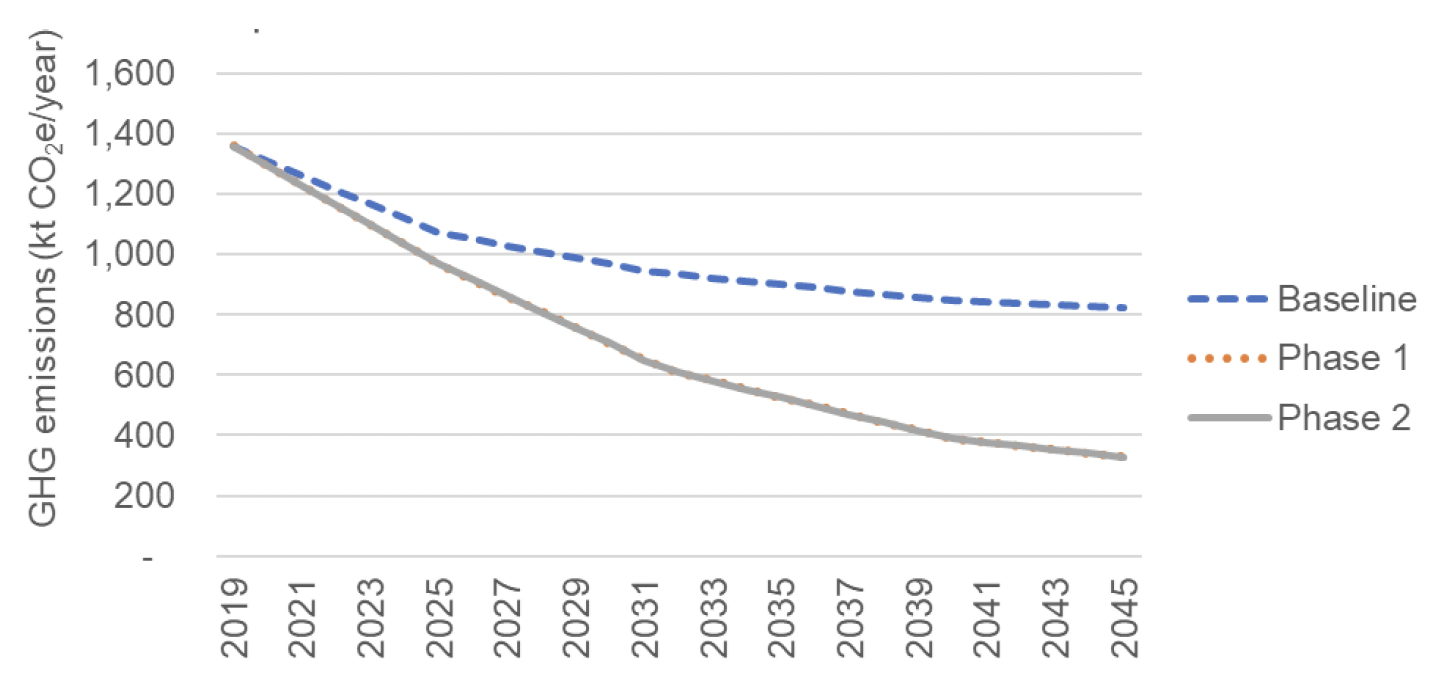
Note: The results from Phases 1 and 2 are visibly almost indistinguishable from each other because of the small magnitude of differences between them.
9.3.4 Emissions reduction by policy package (2032) – Phase 1 & 2
This section presents results on the contribution of each policy package to emission reductions of each policy outcome considered in the model. Packages W1 and W3 (see Section 9.2.3 for package details) interact, so are considered together here. Package W1 (focused on reducing biodegradable waste and total waste sent to landfill) delivers all of the expected emissions reductions quantified here for the Waste sector.
For package W2, it was not possible to analyse this policy separately due to the lack of data – it is essentially intrinsically modelled. Methane emissions from closed landfills, as described in package W2, are likely to be smaller than from active landfills, since it is assumed the a large fraction of organic matter has already undergone the degradation process responsible for methane production. Based on the results following the investigative work on those identified 12 sites, it should be possible to determine the potential emission reduction associated with the measure. As part of this project, the impact of capturing landfill gas from 12 additional sites (W2) has been taken into account as part of the modelling for emission from landfills. This based on the quantity currently captured in Scotland and its impact is quite modest.
| Policy Package | Emissions reductions by 2032 (kt CO2e) | |||||
|---|---|---|---|---|---|---|
| Phase 1 | Phase 2 | |||||
| Central Growth | High Growth | Low Growth | Central Growth | High Growth | Low Growth | |
| W1+W3 | -325 | -323 | -327 | -325 | -323 | -327 |
| W2 | 0 | 0 | 0 | 0 | 0 | 0 |
| Total | -325 | -323 | -327 | -325 | -323 | -327 |
9.4 Uncertainties
Due to the number of assumptions used, we suggest that the energy use and GHG emission projections are indicative but are sufficient to allow an informed debate about the future trajectory of emissions in the sector, and, to identify policies which are likely to deliver meaningful GHG reductions. For example, there is a high level of uncertainty associated with the amount of utilised and flared landfill gas, the effect and the implementation of waste diversion, and the technical and economic implementation of several proposals, whose impact cannot be assessed.
9.5 Sensitivities
The two sources with the largest methane emissions in the Waste sector are landfills, and wastewater treatment.
Waste to landfill:
- The magnitude of GHG emissions in the waste to sector are sensitive to:
- The quantities of biodegradable waste generated, and so by inference, the split between inert and biodegradable waste in waste arisings
- The quantities of biodegradable waste sent to landfill. Emissions can be reduced by diverting biodegradable to AD and composting routes and using methane capture at landfills.
- Although there are large uncertainties in the lifetime methane emissions per tonne of waste disposed to landfill, food waste and garden waste generally have the highest biodegradable component that is responsible for methane emissions.
Wastewater treatment
- In this study, the emissions have assumed to scale according to changes in population and GVA.
Waste incineration
- Waste combustion is not considered in this sector as part of this study.
Contact
Email: Edward.Mchardy@gov.scot
There is a problem
Thanks for your feedback