Greenhouse gas emissions projections: phase 1 and phase 2 modelling results
Analysis undertaken by Ricardo-AEA for the Scottish Government to provide an estimated projection of Scottish emissions from 2019 to 2045 which capture announced Scottish and UK policies.
Appendix 1. Land Use, Land-Use and Foresty (LULUCF)
Scottish Government Projections: LULUCF sector
Authors: Amanda Thomson, Hannah Clilverd, Gwen Buys
Date: 21st November 2022
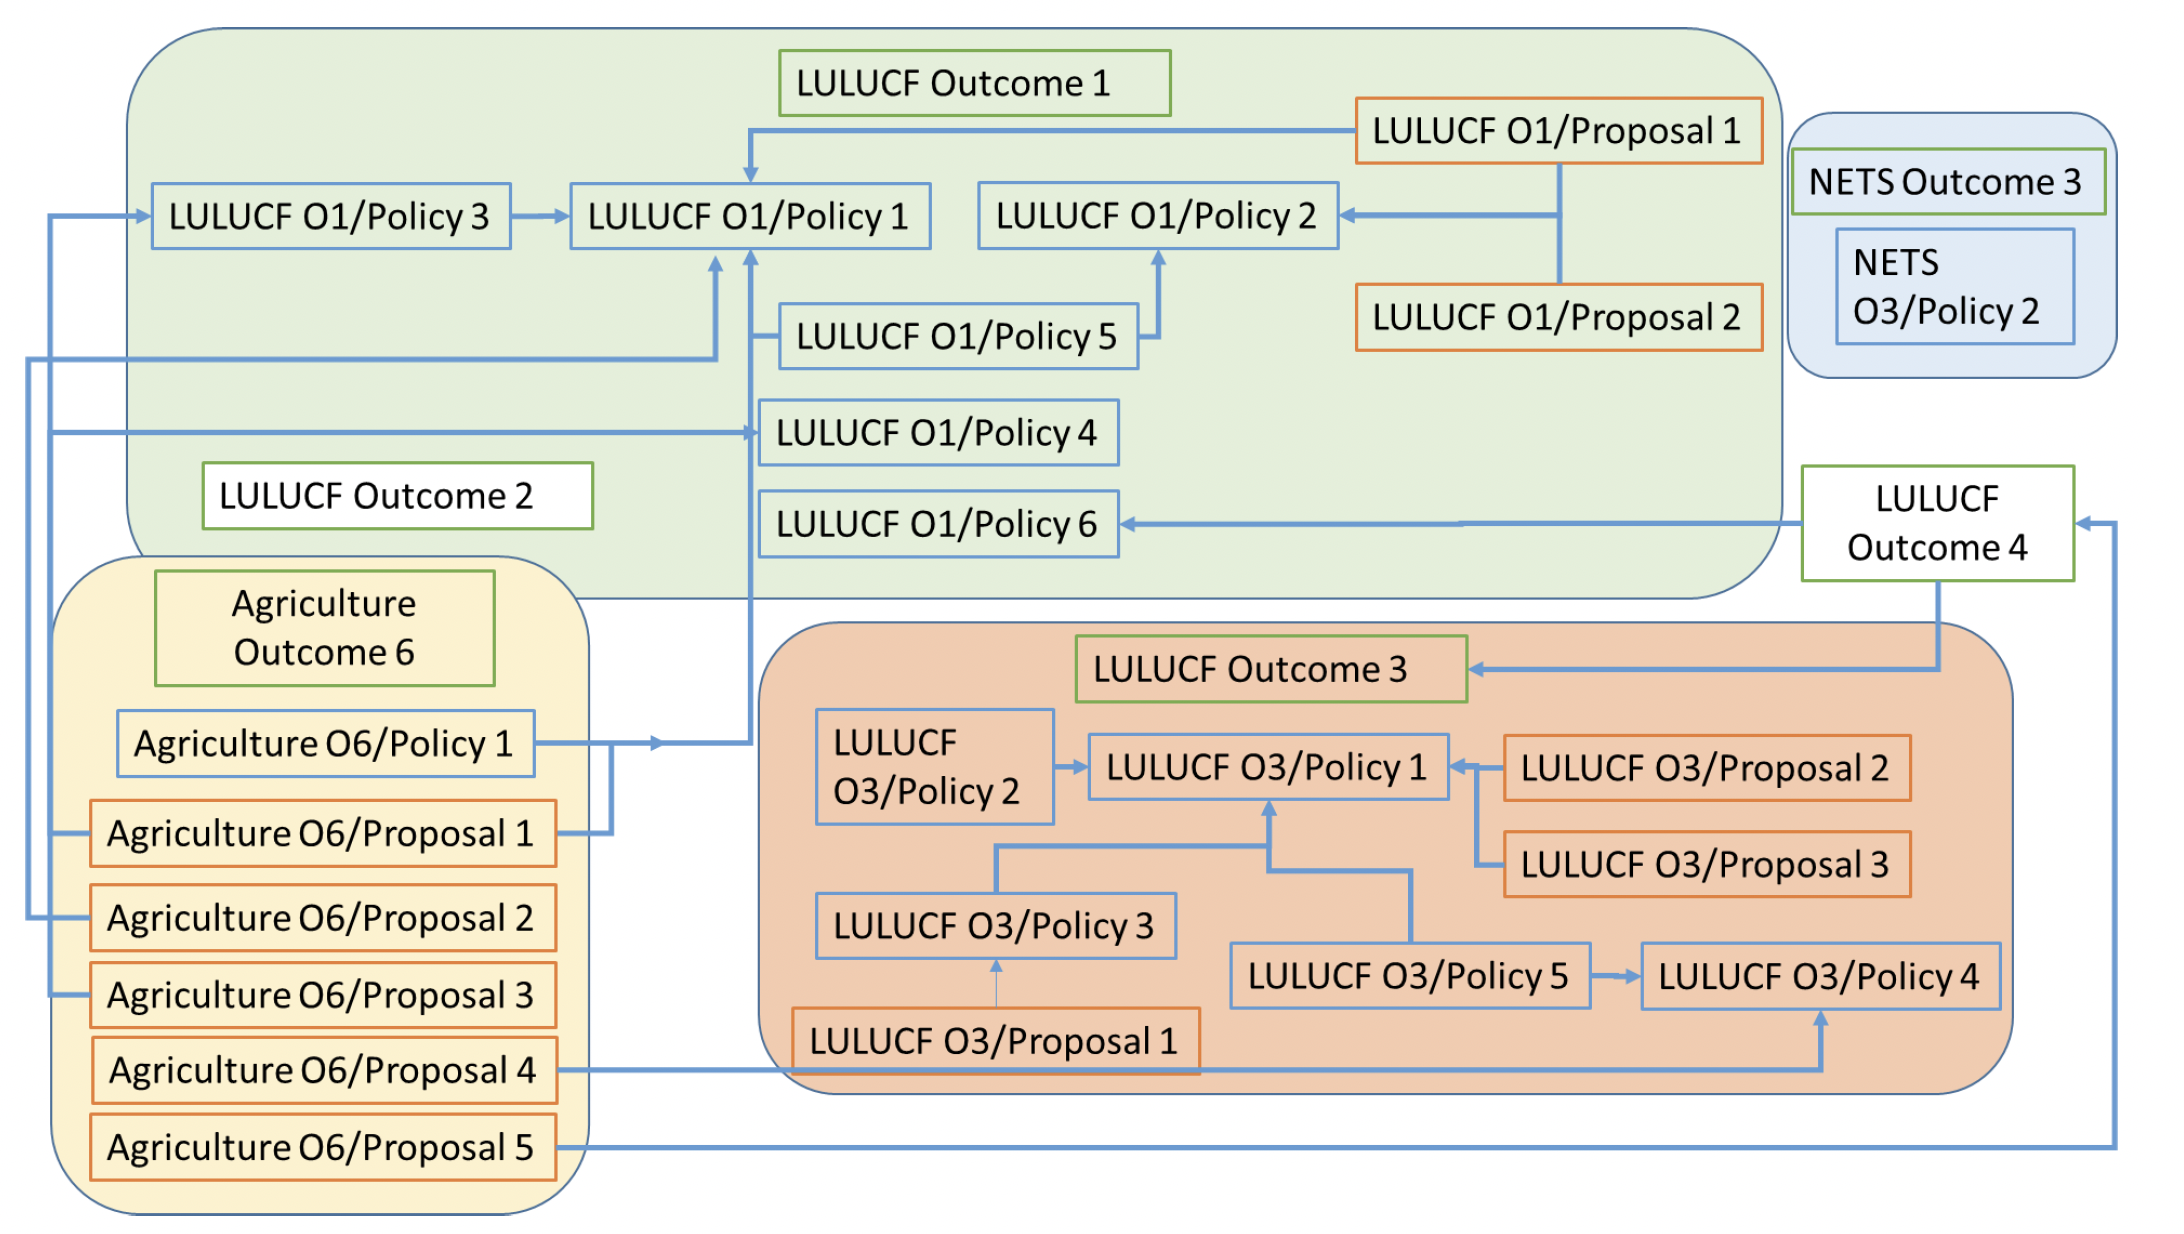
UKCEH have assessed six Outcomes, underpinned by 13 policies and 10 proposals in the LULUCF, Agriculture and Negative Emissions Technologies sectors. The majority of these are related to forestry/woodland and peat restoration activities. UKCEH have produced quantified emission projection scenarios where possible, and discuss if quantification of projected emissions is possible in other cases. There are linkages between many of the policies and proposals, as shown in Figure 12‑5.
12.1 LULUCF Outcome 1: We will introduce a stepped increase in the annual woodland creation rates from 2020-2021 to enhance the contribution that trees make to reducing emissions through sequestering carbon.
The Climate Change Plan Update (CCPU 2018-2032) has targets for annual woodland creation for 2020/21 to 2024/25, stepping up to a maximum of 18,000 ha p.a. The Climate Change Plan Monitoring Reports 2022 Compendium (CCPu Monitoring Compendium) indicator for this outcome is that levels of woodland creation are on-track. These planting targets are reflected in the assumptions underpinning the LULUCF Central Scenario GHG emission projections for the 1990-2019 inventory (submitted to BEIS but not yet published). Annual woodland creation rates return to a very low level (326 ha p.a.) from 2025/26 onwards. The GHG emissions from forestry in the LULUCF Central Scenario projections are modelled using the Forest Research CARBINE model. CARBINE is a carbon accounting model that calculates gains and losses in pools of carbon in standing trees, litter and soil in conifer and broadleaf forests. It represents UK forestry systems as a combination of tree species composition, tree growth rate (yield class) and management regime. Information on forestry systems comes from the Sub-compartment Database of publicly owned and managed woodlands, and the National Forest Inventory survey of woodlands for privately owned woodlands.
The CCPU 2018-2032 (page 19) also has a target of 21% of Scottish land area covered by forest by 2032. This would not be achieved by the current woodland creation targets to 2024/25, which would increase woodland cover from 18.8% in 2021 to 19.8% by 2025. In order to achieve the 21% target, a woodland creation rate of 18,000 ha p.a. would have to be maintained between 2025/26 and 2030/31. The planting rates used in this modelling for Policy 1 and Policy 2 are shown in Table 1.
| Year | Annual planting rate, ha | ||||
|---|---|---|---|---|---|
| Sector Split | Tree Type Split | Total planting | |||
| Public planting | Private planting | Broadleaf planting | Conifer planting | ||
| 2019 | 1,030 | 10,190 | 4,037 | 7,173 | 11,220 |
| 2020 | 270 | 10,780 | 3,803 | 7,247 | 11,050 |
| 2021 | 570 | 10,090 | 3,803 | 6,857 | 10,660 |
| 2022 | 782 | 13,843 | 5,224 | 9,401 | 14,625 |
| 2023 | 862 | 15,263 | 5,760 | 10,365 | 16,125 |
| 2024 | 942 | 16,683 | 6,296 | 11,329 | 17,625 |
| 2025-2030 | 962 | 17,038 | 6,430 | 11,570 | 18,000 |
| 2031-2045 | 17 | 309 | 116 | 210 | 326 |
We used the Woodland Carbon Code (WCC) Calculator (version 2.4 March 2021) to estimate the impact on net carbon emissions and removals of these increased woodland creation rates on Forestry and Land Scotland (FLS) land (public planting) and private land (assumed all funded by the Forestry Grant Scheme). The WCC Calculator takes account of cumulative carbon sequestration in living biomass and debris, emissions from woodland establishment and emissions from ongoing management. It is based on the same underlying yield tables as CARBINE, but cannot represent the same level of management detail. There are yield tables for the most commonly planted species in the UK, listed by yield class (YC). Forest Research define YC as "an index used in Britain of the potential productivity of even-aged stands of trees. It is based on the maximum mean annual increment of cumulative timber volume achieved by a given tree species growing on a given site and managed according to a standard management prescription."
The WCC Calculator results were compared with the LULUCF Central Projection results for biomass carbon stock change for the Land converted to Forest GHG Inventory category, i.e. the sum of all annual biomass stock change from areas of woodland creation in the 20 years preceding the year of reporting (e.g. 2019: woodland creation 1999-2019). We used the same areas of broadleaf and conifer planting, assuming species/yield/management classes of:
- Broadleaf: Sycamore/Ash/Birch YC 6, 2.5m spacing, no thinning
- Conifer: Sitka Spruce YC16, 2.0m spacing, thinning management
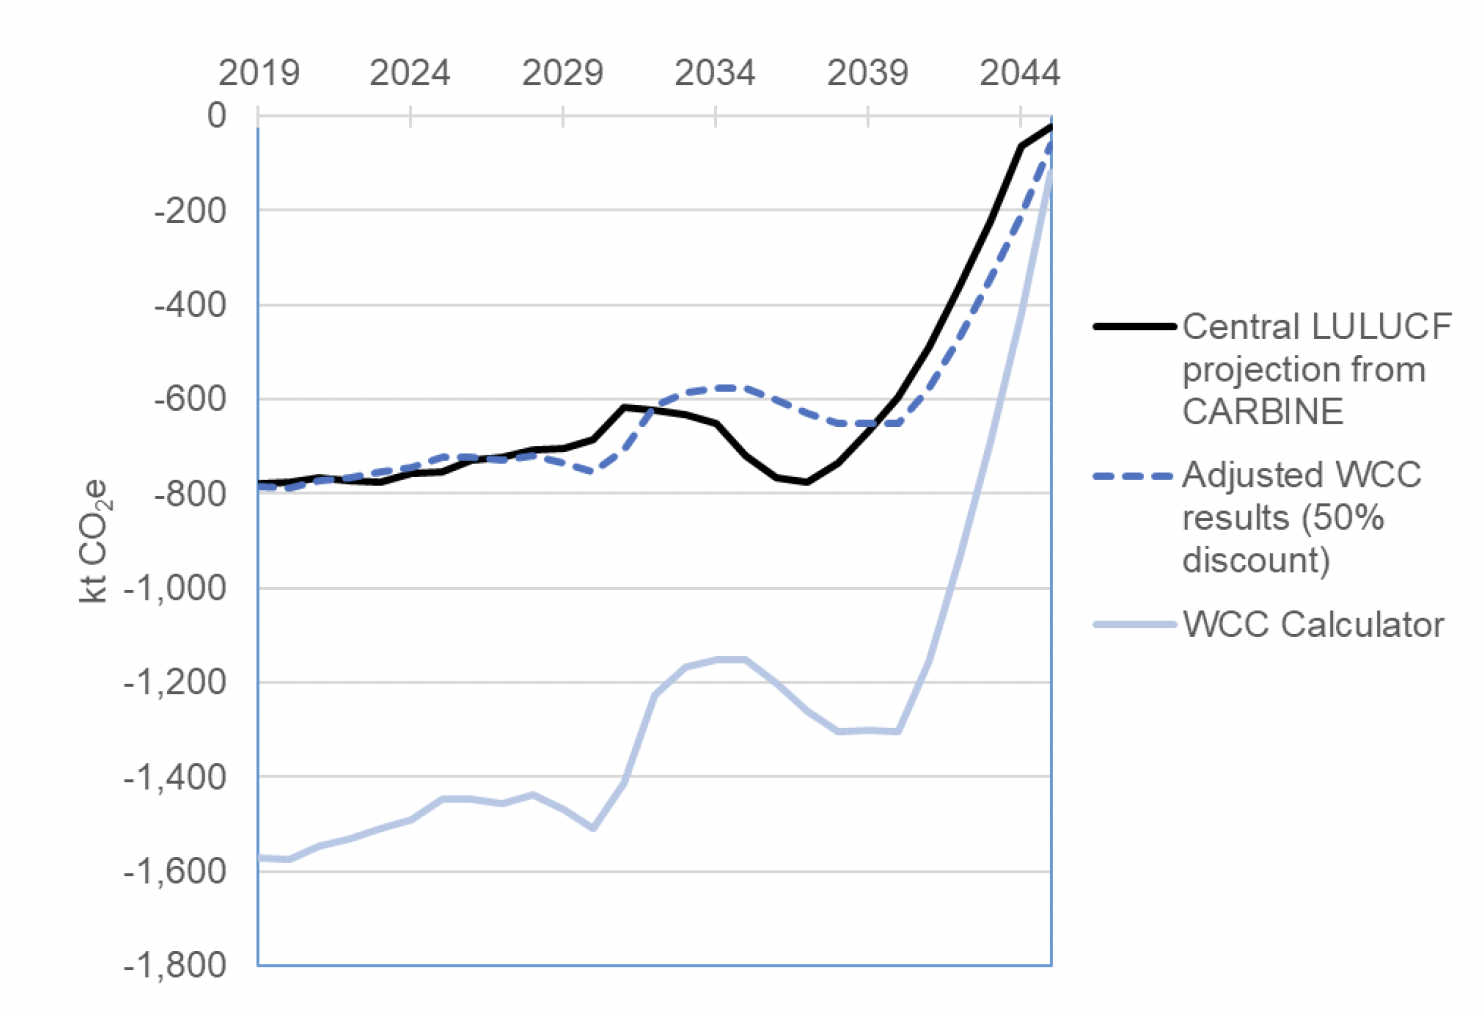
These species are the most commonly planted in Scotland and the assumptions match those used in the quantitative analysis used for the Committee on Climate Change 6th Carbon Budget report (Thomson et al. 2021). An assumption of 15% open space was included in the area planted and the results include the 20% discount for WCC model precision but not the 20% contribution to the buffer for carbon issuance units. The comparison is shown in Figure 12‑6. The WCC Calculator results exhibit the same trend over time as the Central projection from CARBINE, but carbon sequestration estimates are much larger. In discussion with Forest Research experts this difference is due to several factors: CARBINE includes a much wider range of species, yield classes and management regimes in historic and projected planting, and also incorporates mortality and decomposition in its calculations. The WCC Calculator results were calibrated to the CARBINE output using a 50% discount, giving a much closer match. Any future work in this area should ideally make use of the CARBINE model directly.
We included emissions from soil disturbance from seedling establishment in the WCC Calculator (-0.38 tCO2e/ha based on 2.0m seedling spacing) but did not include other emissions from establishment such as fuel used in ground preparation, tree shelters, fencing, herbicide, road building or removal of other vegetation from the site. Neither did we include the soil carbon emission calculation of the WCC: for soils on pasture or semi-natural grassland. The WCC Calculator assumes soil carbon emissions are zero for negligible or low disturbance planting but 2% (11.7 t CO2e/ha) of soil carbon is lost with medium disturbance on mineral soils and 10% (58.7 t CO2e/ha) with organomineral soils (higher disturbance planting approaches have even higher losses). Project resources did not allow for an in-depth assessment of the distribution of planting on different soil types or with different planting approaches. Only planting on mineral soils previously in arable use allows for soil carbon accumulation in the WCC Calculator, and this is insignificant in Scotland.
The estimated net emission factors for soil carbon (losses and accumulation) in the national GHG Inventory for woodland establishment on grassland are 3.2 t CO2e/ha/yr for broadleaf and 2.6 t CO2e/ha/yr for conifer for planting <20 years old (losses to the atmosphere), and -0.5 t CO2e/ha/yr for broadleaf and -1.8 t CO2e/ha/yr for conifer from older woodlands. These are broadly comparable overall with the WCC rates for medium disturbance on mineral soils.
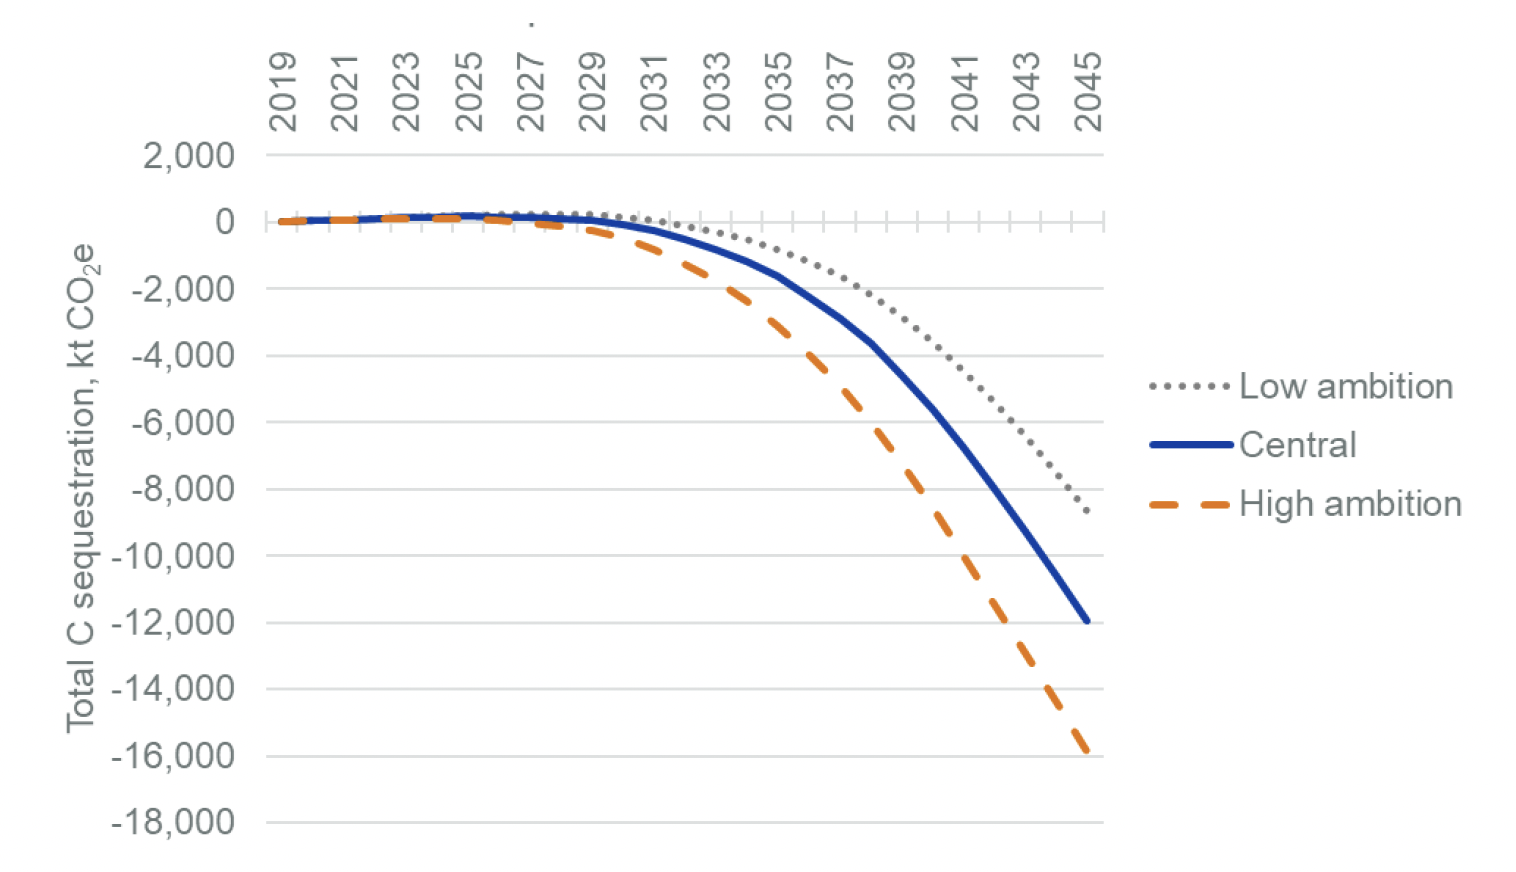
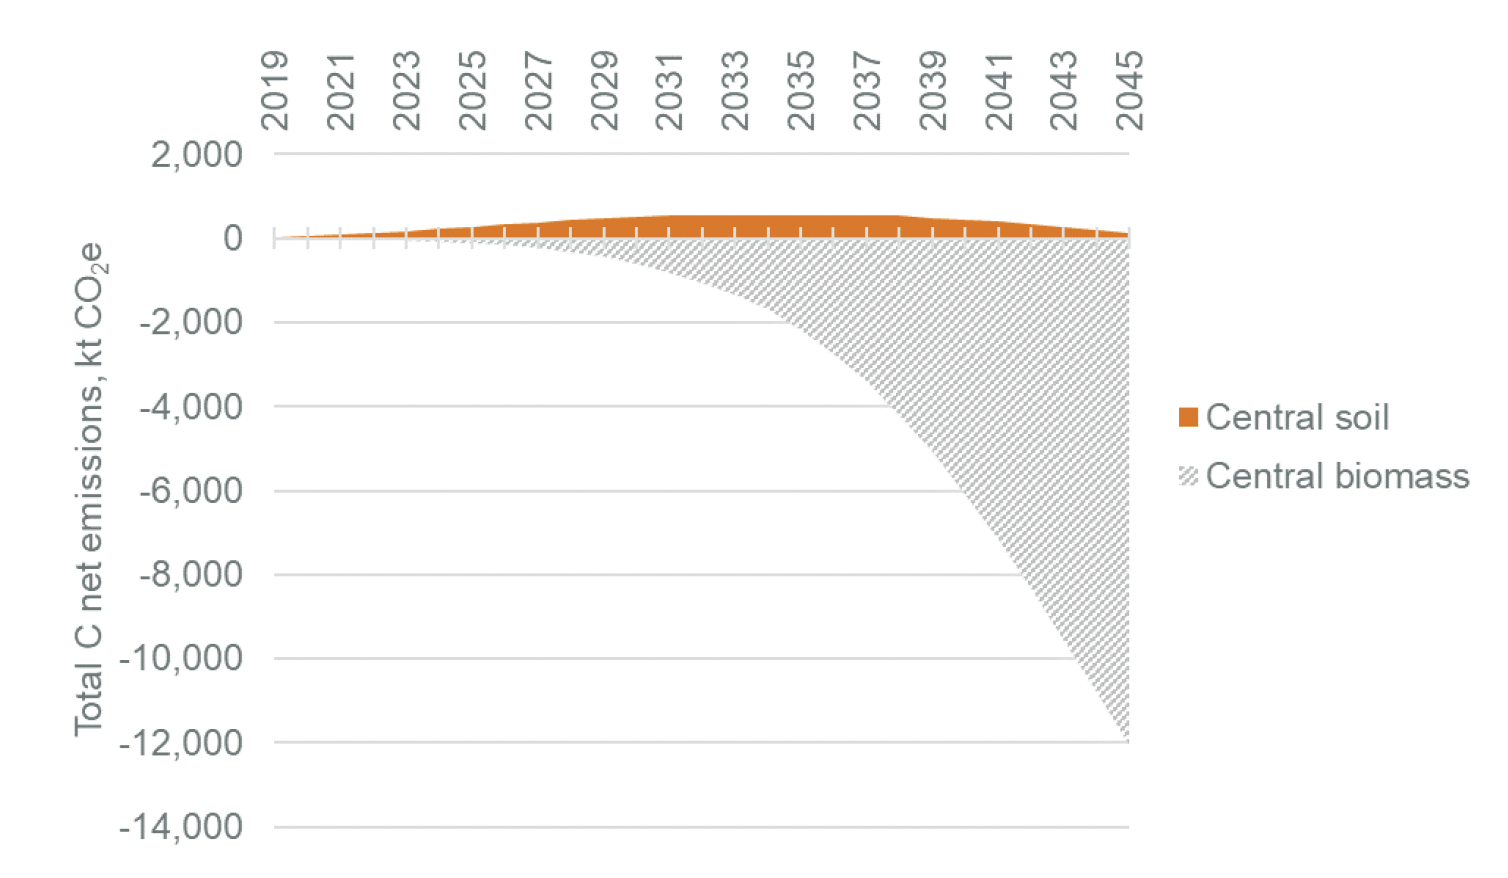
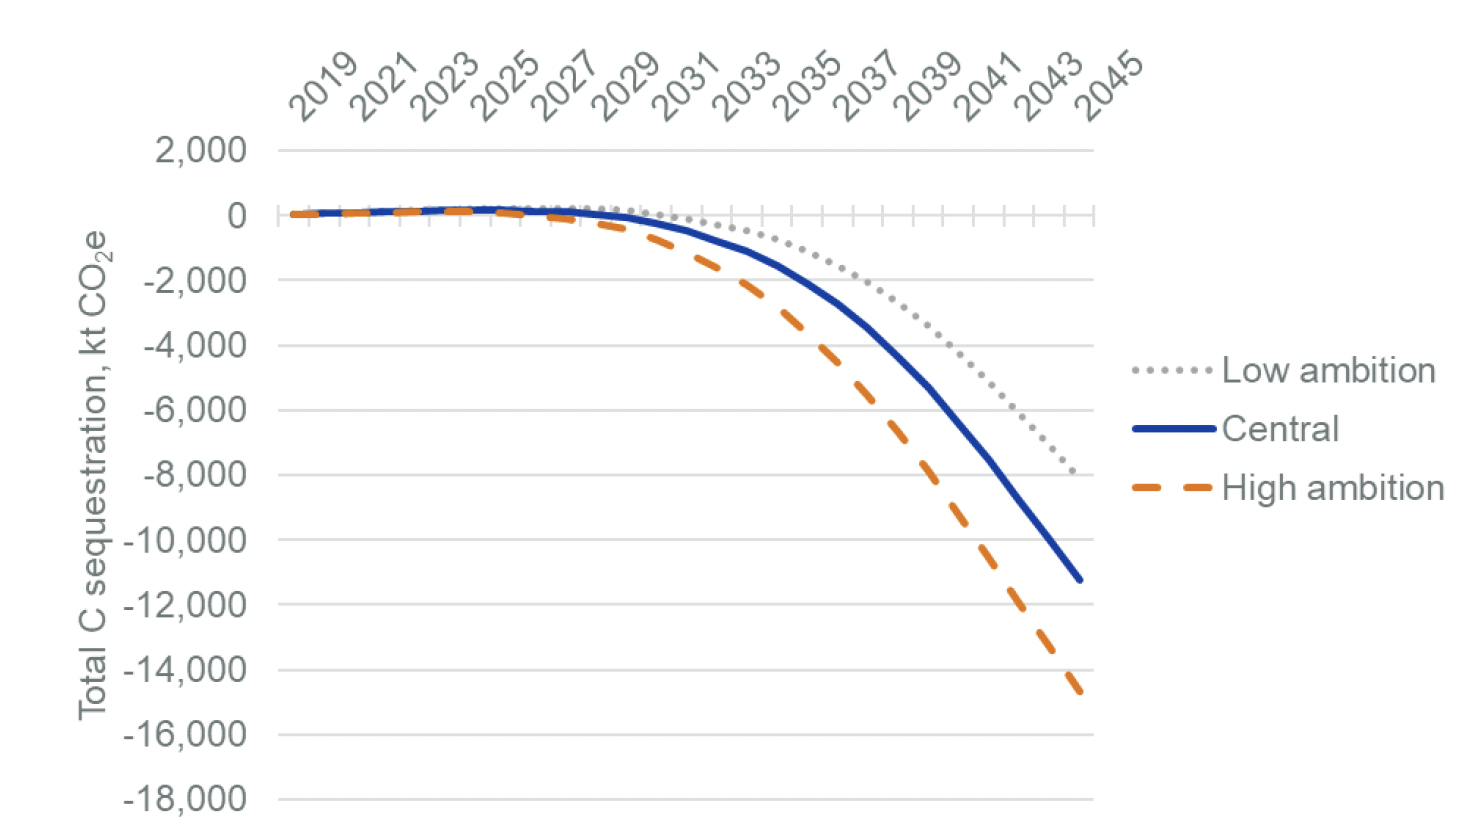
Net carbon emissions from woodland creation on public and private land were calculated separately and combined for the total from this Outcome (Figure 12‑7). Biomass net carbon sequestration was estimated using the WCC Calculator and adjusted using a 50% discount, and net soil carbon emissions were calculated using the estimated emission factors from the LULUCF inventory (Figure 12‑8). High and low growth scenarios were produced by changing the species-yield class assumptions rather than the area planted.
The estimated total net carbon sequestration from woodland creation by 2045 in the Central scenario is -11.9 Mt CO2e (-15.9 Mt CO2e in the High growth scenario, and -8.6 Mt CO2e in the Low growth scenario).
Caveats: These greenhouse gas emission estimates will likely be superseded by a new report on forestry and climate change modelling by Forest Research, FLS etc., with a summary report published in July 2022[62]. This report gives annualised rates of carbon sequestration under different management options and different time periods, and it has not been possible to directly compare detailed results. At a high level, the estimated annualised carbon sequestration rates for planting 2019-2045 (12.5, 19.5 and 7.7 tCO2/yr for the Central, High and Low scenario) lie within the range of 0 tCO2/yr for lightly managed broadleaves and 16.0-56.1 tCO2/yr for moderate/fast growing thinned conifers for planting 2022-2025.
Results are discussed in subsequent text
12.1.1 Policy 1: Forestry grants: we will provide funding via a grant scheme, to support eligible land owners establish appropriate woodlands –Full assessment
It was assumed that 95% of the woodland created under the annual targets would be on private land, based on the percentage in 2021, and funded by the Woodland Creation component of the Scottish Forestry Grant Scheme (SFGS). There are 10 planting options under this scheme and a woodland species class was assigned to each planting option. The assumptions on woodland species class were based on Scottish woodland composition from the National Forest Inventory, information in the SFGS criteria and assumed yield classes in the CCC Balanced Pathway scenario and BEIS GGR scenario modelling (Table 12‑4). The area of woodland created did not change between the Central, High and Low scenarios, but the species YC assumptions did change. The proportion of each option was estimated from the mean claimed areas of each option in the January 2022 SFGS Statistics and kept constant over time.
Although Agroforestry is one of the SFGS options, the SFGS statistics do not record any claimed areas in the past five years. Other SFGS schemes are for harvesting and processing, woodland improvement and sustainable management do not contribute to the woodland creation targets.
| Species/yield class/Management assumption | ||||
|---|---|---|---|---|
| SFGS Option | Central scenario | High growth scenario | Low growth scenario | % 2017-2021 |
| Conifer | Sitka spruce, YC16, Thinned, 2.0m spacing | Sitka spruce, YC20, Thinned, 2.0m spacing | Sitka spruce, YC14, Thinned, 2.0m spacing | 51.2% |
| Diverse conifer | Norway spruce, YC16, Thinned, 1.5m spacing | Norway spruce, YC20, Thinned, 1.5m spacing | Norway spruce, YC14, Thinned, 1.5m spacing | 7.0% |
| Broadleaves | Beech, YC8, Thinned, 2.5m spacing | Beech, YC10, Thinned, 2.5m spacing | Beech, YC6, Thinned, 2.5m spacing | 4.0% |
| Native Broadleaves | Sycamore/Ash/Birch, YC8, No-thinning, 2.5m spacing | Sycamore/Ash/Birch, YC10, No-thinning, 2.5m spacing | Sycamore/Ash/Birch, YC6, No-thinning, 2.5m spacing | 14.1% |
| Native Scots Pine | Scots Pine, YC10, No-thinning, 2.0m spacing | Scots Pine, YC14, No-thinning, 2.0m spacing | Scots Pine, YC8, No-thinning, 2.0m spacing | 7.4% |
| Native Upland Birch | Sycamore/Ash/Birch, YC6, No-thinning, 2.5m spacing | Sycamore/Ash/Birch, YC8, No-thinning, 2.5m spacing | Sycamore/Ash/Birch, YC4, No-thinning, 2.5m spacing | 9.7% |
| Small or Farm Woodland | Sycamore/Ash/Birch, YC8, No-thinning, 2.5m spacing | Sycamore/Ash/Birch, YC10, No-thinning, 2.5m spacing | Sycamore/Ash/Birch, YC6, No-thinning, 2.5m spacing | 1.0% |
| Native broadleaves in Northern and Western Isles | Sycamore/Ash/Birch, YC6, No-thinning, 2.5m spacing | Sycamore/Ash/Birch, YC8, No-thinning, 2.5m spacing | Sycamore/Ash/Birch, YC4, No-thinning, 2.5m spacing | 0.1% |
| Native Low Density | 80% Natural Regeneration-Mixed Broadleaf, YC4, No-thinning, 3.0m spacing 20% Natural Regeneration- Scots Pine, YC4, No-thinning, 2.0m spacing | 80% Natural Regeneration-Mixed Broadleaf, YC4, No-thinning, 3.0m spacing 20% Natural Regeneration- Scots Pine, YC4, No-thinning, 2.0m spacing | 80% Natural Regeneration-Mixed Broadleaf YC2, No-thinning, 3.0m spacing 20% Natural Regeneration- Scots Pine, YC2, No-thinning, 2.0m spacing | 1.1% |
| Natural regeneration | 80% Natural Regeneration-Mixed Broadleaf, YC4, No-thinning, 3.0m spacing 20% Natural Regeneration- Scots Pine, YC4, No-thinning, 2.0m spacing | 80% Natural Regeneration-Mixed Broadleaf, YC4, No-thinning, 3.0m spacing 20% Natural Regeneration- Scots Pine, YC4, No-thinning, 2.0m spacing | 80% Natural Regeneration-Mixed Broadleaf, YC2, No-thinning, 3.0m spacing 20% Natural Regeneration- Scots Pine, YC2, No-thinning, 2.0m spacing | 4.4% |
The estimated total net carbon sequestration from woodland creation by 2045 in the Central scenario is -11.2 Mt CO2e (-14.7 Mt CO2e in the High growth scenario, and -8.1 Mt CO2e in the Low growth scenario) (Figure 12‑9).
12.1.2 Policy 2: Woodland creation on Scotland's national forests and land. Forestry and Land Scotland will deliver an annual contribution towards the overall woodland creation target by creating new sustainable woodland on Scotland's national forests and land, including through partnerships with external organisations to scale carbon capture opportunities. – Full assessment
It was assumed that 5% of the woodland created under the annual targets would be on Scotland's national forests and land, based on the percentage in 2021. Of this area, 22% would be conifers and 78% broadleaves, based on planting proportions in 2020-21. The assumptions on woodland species class were based on Scottish woodland composition from the National Forest Inventory and assumed yield classes in the CCC Balanced Pathway scenario and BEIS GGR scenario modelling (Table 12‑6). The area of woodland created did not change between the Central, High and Low scenarios, but the species YC assumptions did change.
| Central Scenario | High growth scenario | Low growth scenario | |
|---|---|---|---|
| Broadleaf planting | Sycamore/Ash/Birch, YC6, No-thinning, 2.5m spacing | Sycamore/Ash/Birch, YC10, No-thinning, 2.5m spacing | Sycamore/Ash/Birch YC4 No-thinning, 2.5m spacing |
| Conifer planting | Sitka spruce, YC16, Thinned, 2.0m spacing | Sitka spruce, YC20, Thinned, 2.0m spacing | Sitka spruce, YC14, Thinned, 2.0m spacing |
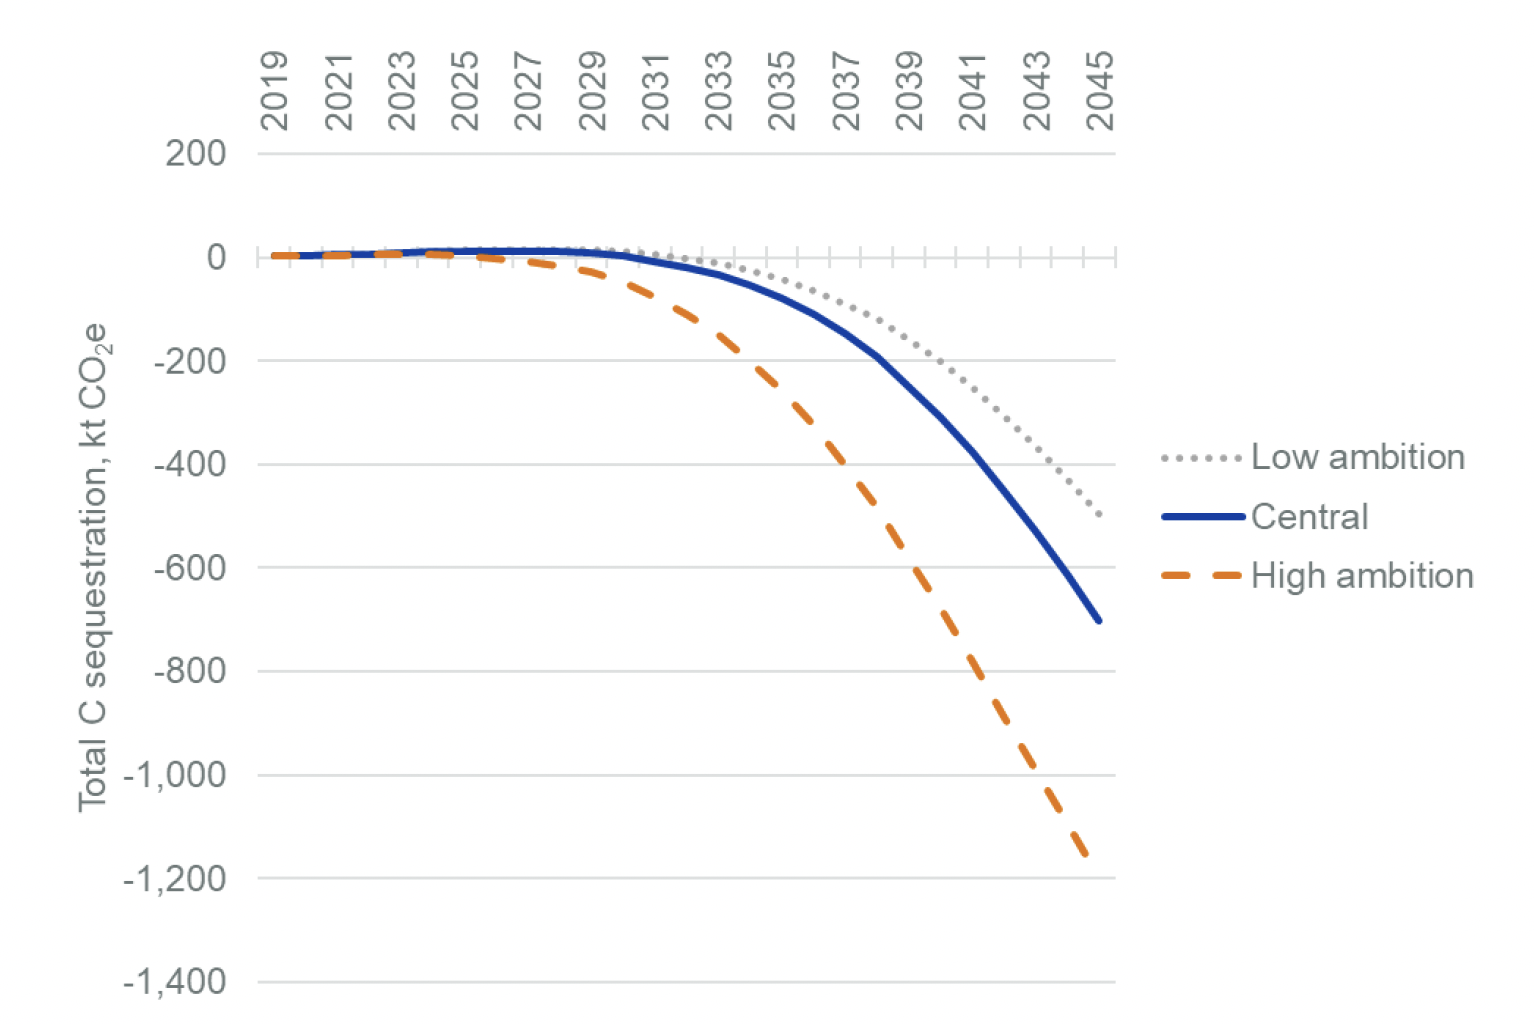
The estimated total net carbon sequestration from woodland creation by 2045 in the Central scenario is -0.7 Mt CO2e (-1.2 Mt CO2e in the High growth scenario, and -0.5 Mt CO2e in the Low growth scenario (Figure 12‑10).
12.1.3 Policy 3: Awareness-raising. We will continue to deliver a programme of farm-based events to demonstrate and support improved productivity through integration of farming and forestry enterprises - Indicative assessment
We suggest that this policy should be screened out at this stage as it is not possible to quantify associated impacts on GHG emissions. The assessment of the impact of this policy would depend on knowing how many farmers/foresters attending events, how many of them subsequently took action (e.g. through applying for targeted grants), and an assessment of whether this action was additional to what would have occurred in the absence of a programme of events. It is unlikely that this policy would affect woodland creation rates directly but an events programme could have value in influencing farmers' cultural beliefs and attitudes towards trees on farmland (see Staddon et al 2021 NEER020). As part of a suite of policies, such as Policy 6 and the policies and proposals under Agriculture Outcome 6, it could be anticipated to have a small positive impact on the uptake of woodland creation grants for small/farm woodland and agroforestry. However, there is not currently enough information to quantify this impact further.
12.1.4 Policy 4: Woodland standards. The Scottish Government will lead on the work with the UK and other UK Governments to maintain and develop a UK Forestry Standard that articulates the consistent UK wide approach to sustainable forestry. The Standard defines how woodland should be created and managed to meet sustainable forest management principles and provides a basis for monitoring. - Indicative assessment
We suggest that this policy should be screened out at this stage as it is not possible to quantify. The updated UK Forestry Standard is due to be published by the end of 2022. Creation and management of woodland to meet sustainable forest management principles could have either a positive or negative impact on net greenhouse gas emissions depending on the context, previous management and timescales under consideration.
12.1.5 Policy 5: Woodland carbon capture. The Scottish Government will further develop and promote the Woodland Carbon Code in partnership with the forestry sector, and will work with investors, carbon buyers, landowners and market intermediaries to attract additional investment into woodland creation projects and increase the woodland carbon market by 50% by 2025. –Full assessment
The target in the CCPU (2018-2032) is to increase the woodland carbon market by at least 50% by 2025. There were 3.791 million validated credits in the Woodland Carbon Code Registry in Scotland in March 2020, and interim statistics (March 2022) project a total of 5.5 million validated credits, with 8.9 million credits under development. This indicates that the woodland carbon capture target is achievable for 2025, although it should be noted that these figures include both the carbon units that can be sold and those that are allocated to the WCC buffer.
All WCC project areas are on private land and some areas receive additional funding from the SFGS and will already be included under Policy 1. Additional information is required to ascertain to what extent WCC project areas overlap with woodland created via grant-aided planting, and which areas are created solely with additional WCC funding. This was discussed with Scottish Government policy makers but resources did not permit the data collation and analysis within the project timeframe. WCC planting is additional to other woodland creation in carbon terms.
12.1.6 Policy 6: Forestry and woodland strategies. Forestry and woodland strategies continue to be prepared by planning authorities, with support from Scottish Forestry. They provide a framework for forestry expansion through identifying preferred areas where forestry can have a positive impact on the environment, landscape, economy and local people. - Indicative assessment
We suggest that this policy should be screened out at this stage as it is not possible to quantify. This policy will contribute to the attainment of policies 1 and 2. There are also potential interactions with Regional Land Use Partnerships (LULUCF Outcome 4/Policy 1) and the farm woodland proposals under Agriculture Outcome 6.
12.1.7 Proposal 1: Support forestry sector on plant and seed supply strategy to help meet the increased planting targets. A programme of technical innovation to develop and adapt modern horticultural practices will help improve seed preparation and handling, techniques to reduce environmental impacts, and increase nursery production. Funding to support increased production of young trees is available through the Harvesting and Processing grant which is now open to forest nurseries across GB with support from Defra. - Indicative assessment
It is likely that this proposal, if implemented, would result in a small positive impact on net greenhouse gas emissions and contribution to woodland creation due to reduced mortality of seedlings and young trees, reduced environmental impact and reduced need for importation from outside Scotland (with associated reduction in transport costs etc.). This benefit would only be quantifiable once trees have been established, rather than at the nursery stage. The CCPu Monitoring Compendium indicated that there has been good uptake of the grant scheme, with 158 grants claimed since 2016 (£3,155,134) and a further 238 approved (FGS Statistics January 2022).
12.1.8 Proposal 2: Forestry and Land Scotland will begin development of a new approach to woodland investment with a view to acquiring more land to establish further woodland on Scotland's national forests and land for the benefit of future generations and to optimise carbon sequestration. This includes partnering with private sector and other organisations to enhance scale and funding of carbon capture projects. - Indicative assessment
Forestry and Land Scotland have indicated that they will explore how to enhance their existing peatland restoration programme, ensuring that any forest removals on peatland are replaced by new forest planting on suitable land (CCPU, p. 178). This would be additional to planned woodland creation. An area of 5,570 hectares of peatland with woodland cover on FLS land has been rewetted 2015-2020 (Peatland Action and FLS data).
Planting an equivalent area (with a five year offset between rewetting and planting) with new conifer forest on mineral soil (assumed Sitka spruce YC12) would result in carbon sequestration of 0.4 Mt CO2e by 2045. The equivalent area of Sitka spruce YC8 (assumed aged 40 years old in 2020) would have a total carbon sequestration of 0.05 Mt CO2e in 2020 and 0.7 Mt CO2e by 2045. (These numbers are for biomass carbon only and do not take account of soil carbon emissions or removals beyond establishment emissions for new forest on mineral soil).
12.2 LULUCF Outcome 2: Increase the use of sustainably sourced wood fibre to reduce emissions by encouraging the construction industry to increase its use of wood products where appropriate.
12.2.1 Policy 1: In collaboration with the private forest sector and other public sector bodies the Scottish Government will implement the Timber Development Programme through an annual programme of projects that support the promotion and development of wood products for use in construction. - Indicative assessment
We suggest that this policy should be screened out at this stage as it is not possible to quantify, and is an enabling policy rather than one that has a direct impact on emissions. Further information is needed on how much of the sustainably sourced wood fibre will come from within Scotland/the UK, and the quantified targets of the Timber Development Programme. The CCPu Monitoring Compendium lists the indicator for this Outcome as "Off-Track" The commentary for this indicator is that an estimated 2.09 million cubic metres of Scottish produced sawn wood and panel boards were used in used in construction in 2020 (the indicator milestone was 2.6 million m3), due to the COVID-19 pandemic. The review on wood in construction in Scotland by Kerkvliet-Hermans (2020) discusses the high proportion of timber-framed new builds in Scotland compared to the rest of the UK (83% vs. 28% in 2016) and the potential for increased timber substitution and associated CO2 emission reductions compared with high CO2 footprint construction materials such as concrete and steel.
12.3 LULUCF Outcome 3: To enhance the contribution of peatland to carbon storage, we will support an increase in the annual rate of peatland restoration
12.3.1 Policy 1: Restoration grants: We will provide grant funding to support eligible land managers to deliver peatland restoration. Levels of funding will enable at least 20,000 hectares of peatland restoration per year. We will undertake research to inform where restoration can deliver the greatest emission savings per hectare. –Full assessment
The 2018 Climate Change Plan set a peatland restoration target of 250,000 ha by 2030, with a target of 50,000 ha by the end of 2019-20. The Committee on Climate Change have suggested an even more ambitious target of around 50,000 ha of peatland restoration per year in the 2021 Progress Report to Parliament (CCC 2021)). Data on peatland restoration in Scotland provided by a peatland restoration compendium from 2000-2012 given in Evans et al. (2017), activities from 2013-2019 compiled by Peatland Action, and a UKCEH Google Earth derived dataset on peat extraction restoration from 1990-2019, totalled 35,595 ha in 2019 (see Table A 3.4.26 in Brown et al. 2021). These data represent restoration actions, such as ditch blocking and damning, carried out to raise the water table to the bog surface, and do not include peatland management activities (e.g., scrub removal, grazing management) that would not cause a site to transition to a rewetted peatland.
There is limited evidence on the timeframe for UK rewetted peatlands to transition to a naturally functioning state, so the interim approach used in this study (and the UK GHG inventory) is to assume that peatland restoration (rewetting) results in an immediate transition to a "Rewetted" emission factor (EF) in the year that the activity to raise the water table occurs. The Rewetted Bog (3.91 t CO2e) and Rewetted Fen (8.05 t CO2e) EFs are derived from studies on formerly degraded sites such as plantation forest, extraction sites, cropland, and pastoral grassland, and thus the rewetted condition categories retain quite high CO2 and/or CH4 emissions (Brown et al. 2023; Evans et al. 2023) compared with near-natural peatlands (NN bog = -0.02 t CO2e; NN Fen = -0.93 t CO2e). No timelines for the transition from the Rewetted Bog/Fen EFs to Near-Natural EFs are currently available. However, for restoration of less heavily degraded sites, i.e. Modified (Heather and Grass Dominated) Bog, a restoration transition to Rewetted Modified Bog is applied in the year of activity, which assigns the same EF as Near-Natural Bog (Brown et al. 2022; Evans et al. 2022).
Initial peat condition areas, and associated emission factors, for 2019 were taken from the 1990-2019 LULUCF GHG inventory (Brown et al. 2021), except for Forestry which employs the combined Tier 2 EF from a literature review and meta-analysis of direct CO2 flux measurements given in Evans et al. (2017) rather than outputs from the Tier 3 CARBINE Model, which was not possible to employ in this analysis, summed with the EFs for indirect CO2 (from dissolved organic carbon and particulate organic carbon), CH4 and N2O employed in the 1990-2019 LULUCF GHG inventory. The Tier 2 EF for direct CO2 for Forest Land on peat (7.39 tCO2e ha-1 yr-1) from Evans et al. (2017) is higher than the CARBINE implied organic soil EFs (2.54 tCO2e ha-1 yr-1 in 1990 to -1.79tCO2e ha-1 yr-1 in 2019) and is possibly a conservative estimate of emissions as it does not explicitly account for lifecycle differences of trees. The decreasing trend in the organic soil carbon EF from CARBINE is due to an increase in age of forests on organic soils with increasing tree inputs (litter, roots etc) counterbalancing organic soil decomposition. The CARBINE model uses the best-case scenarios of yield classes on organic soils, with minimal disturbance associated with forestry on peat, and thus is probably overly optimistic in terms of carbon capture in trees growing on peat and continued loss of carbon from soils over time due to drainage. In both cases, the Tier 2 and Tier 3 EFs on organic soils have a high level of uncertainty due to limited field flux data and require further research.
A combination of IPCC default (Tier 1) and UK-specific (Tier 2) emission factors are used for estimating emissions from peatland/organic soils in the inventory, depending on the availability of UK data. The emission factors and associated uncertainties vary for each peatland condition category depending on the number of studies available for each category (see section A.3.4 of the National Inventory Report Annexes, Brown et al. 2022). The EFs used are subject to periodic updates to incorporate new UK data as they become available, for instance an EF update was implemented in the 1990-2021 inventory, which affected all peatland condition categories (see Evans et al. 2022).
Overall uncertainty in the emissions estimates for peatlands stem from the uncertainties in the emissions factors used, described above, uncertainties in the mapping of peat extent, and uncertainties in the estimates in restored areas since accounting of restoration began in 2000. The peat condition maps for Scotland used in the GHG inventory were developed for the BEIS Wetlands Supplement ((TRN860/07/2014) Project (Evans et al. 2017). The uncertainties associated with the activity data cannot objectively be quantified due to the limited data sources so expert judgement was used to assign peatland condition classes to low, medium and high uncertainty: 10%, 30% and 60%, respectively (see Brown et al 2022 for further details)., however an overall assessment of high/medium uncertainty was given by the authors of the unified peat extent and condition map for use in the inventory (R. Artz, JHI, personal communication to BEIS 25.04.2019).
The CCPu Monitoring Compendium indicator for this policy, of hectares of peatland restored per year, shows that progress towards the policy target is off-track but forecast annual restoration areas are slowly increasing towards the 20,000 hectare target (5,658 in 2020-21, 8,000 in 2021-22, forecast 11,000 in 2022-23 according to the CCPu Monitoring report published May 2022). We have used the average annual rate of peatland restoration from the data sources outlined above to guide realistic restoration scenarios. For the Central peatland mitigation scenario, which we broadly aligned with the BEIS LULUCF 2019 inventory projection assumptions, peatland rewetting for forest, cropland, intensive grassland, settlement and peat extraction continued at 2018-2020 average rates to capture recent increases in restoration activity, a total of 1,615 ha/yr. Most of the peatland restoration (21,112 ha) is applied to eroded modified bog, modified bog, and extensive grassland in proportion to their relative area in 2019, to reach 250,000 ha of peatland restoration by 2030 and a total of 590,909 ha by 2045 (Table 4). It is however important to note that Scottish Government policy is developing and may be updated in the future.
In the High growth mitigation scenario, peatland restoration was targeted at higher-emitting land categories, incorporating an ambitious reduction of peat extraction to zero by 2030 from a stretch BEIS LULUCF emissions projection scenario, and a 40% reduction in cropland and intensive grassland by 2045 from the UK Sixth Carbon Budget. However it is important to note, that unlike England and Wales, Scotland does not currently have a policy in place to ban the sale of peat, therefore this level of ambition may be unrealistic. There is considerable uncertainty associated with the estimates of net emissions from land use. In particular, the current scientific view is that the area of grassland on peat may be overestimated. If this is the case, the impact on net emissions from the combination of a reduction in peat extraction and a reduction in intensive grassland can only be satisfactorily predicted by revised, careful modelling.
Forest on organic soil was restored using an annual rate of 2,523 ha/yr given in 2019. We split the remaining restoration areas among semi-natural peatlands and extensive grassland in the uplands according to their 2019 areas. A total peatland area of ca. 1,947,000 ha is reported in the 2019 GHG inventory (Brown et al. 2021 & 2022). A cumulative area of 250,000 ha of restoration is simulated by 2030, which continues at the same rate across the peat condition categories until 2045 to provide 590,909 ha of restoration in total (Table 4), which is consistent with the 600,000 ha of restorable peatland quoted in the CCC (2022) report to Scottish Parliament. This does not reach the full restoration of upland bog by 2045 recommended in the Sixth Carbon Budget, with ca. 470,000 ha of modified bog remaining.
The Low growth scenario employs the average rate of restoration, 4,760 ha/yr, from 2018-2020, which continues at a constant rate to 2030, with restoration focused in the uplands (comprising 1,496 ha of annual forest to bog restoration, and the remaining areas split between eroding bog, modified bog, and extensive grassland in proportion to their relative area in 2019). No restoration occurs on lowland pastoral land, cropland, or peat extraction sites (Table 4).
| Peat Condition Category | Scenario Area Changes, ha | ||
|---|---|---|---|
| Low | Central | High | |
| Forest | -16,461 | -38,908 | -65,586 |
| Cropland | 0 | 0 | -2,265 |
| Eroding Modified Bog (Bare Peat) | -1,461 | -22,346 | -18,183 |
| Modified Bog (semi-natural heather & grass dominated) | -33,144 | -506,827 | -412,400 |
| Intensive Grassland | 0 | -292 | -28,903 |
| Extensive Grassland (combined bog/fen) | -1,291 | -19,740 | -16,062 |
| Extracted Industrial | 0 | -1,222 | -2,856 |
| Extracted Domestic | 0 | -1,575 | -44,654 |
| Settlement | 0 | 0 | 0 |
| Change in peat condition | -52,357 | -590,909 | -590,909 |
| Rewetted Bog | 17,922 | 82,569 | 128,423 |
| Rewetted Fen | 1,291 | 1,514 | 50,086 |
| Rewetted Modified Bog | 33,144 | 506,827 | 412,400 |
| Change in Restored Area | 52,357 | 590,909 | 590,909 |
The estimated GHG emissions saving from peatland restoration by 2045 in the Central scenario is 1.988 Mt CO2e (2.881 Mt CO2e in the High growth scenario, and 0.218 Mt CO2e in the Low growth scenario). Abatement in the Central scenario is mostly due to modified bogs (77%), with the remaining emissions reduction due to forest (13%), extensive grassland (9%), and peat extraction (1%). Most of the abatement (43%) in the High scenario is from modified bogs, however restoration of cropland, intensive grassland and peat extraction provides a high degree of abatement (37%) while representing a small proportion (13%) of the restored area. However, it should be acknowledged that the immediate transition to a Rewetted Emission Factor, discussed above, may over-estimate how quickly restoration actions can reduce GHG emissions, particularly in formerly degraded sites. That said, the inventory "Rewetted" EFs include studies from a range of heavily modified starting conditions and subsequent recovery periods following restoration, which overall retain elevated GHG emissions, and do not necessarily represent the end state of peatland restoration, which acts to moderate the expected outcome of restoration. This modelling approach is likely to be updated when further data are available on the successful outcomes of restoration (rather than just actions) and the transition period for the reestablishment of the CO2 sink in restored peatlands, which may be on the order of decades (e.g. Nugent et al. 2019; Alderson et al. 2019).
The remaining emissions reduction is due to rewetting of woodland (15%), and extensive grassland (5%). The Low growth scenario projects a small decrease in emissions based on 2018-2020 levels of restoration, with 49% of the abatement attributed to forest to bog restoration, 46% of emissions reduction due to restoration of modified bogs in the uplands, and 5% of the abatement attributed to restoration of extensive grassland to rewetted bog. These estimates do not account for the potential impacts of climate change (e.g. drought, fire, heatwave events) on peatland hydrology, plant communities, and biogeochemical functioning, which may increase peatland emissions in the future. Drained peatlands, in particular, are expected to have lower resilience to climate change compared with undrained and restored areas (e.g. Lees et al. 2021).
Results are discussed in subsequent text
12.3.2 Policy 2: Awareness raising: Working through partnership, we will put in place tools and information to promote peatland restoration and develop the capacity, skills and knowledge of land owners, land managers, contractors and others to deliver peatland restoration. - Indicative assessment
We suggest that this policy should be screened out at this stage as it is not possible to quantify associated impacts on GHG emissions, for the same reasons as LULUCF Outcome 1/Policy 3.
12.3.3 Policy 3: With partners, refresh our vision for Scotland's peatlands and review peatland restoration support mechanisms to overcome embedded barriers and improve how we fund and deliver this activity- Indicative assessment
We suggest that this policy should be screened out at this stage as it is not possible to quantify associated impacts on GHG emissions, for the same reasons as LULUCF Outcome 1/Policy 3.
12.3.4 Policy 4: Phase out the use of peat in horticulture by increasing uptake of alternative materials, undertaking stakeholder engagement to understand transitional challenges, to improve the uptake of alternatives and develop a time-scaled plan–Full assessment
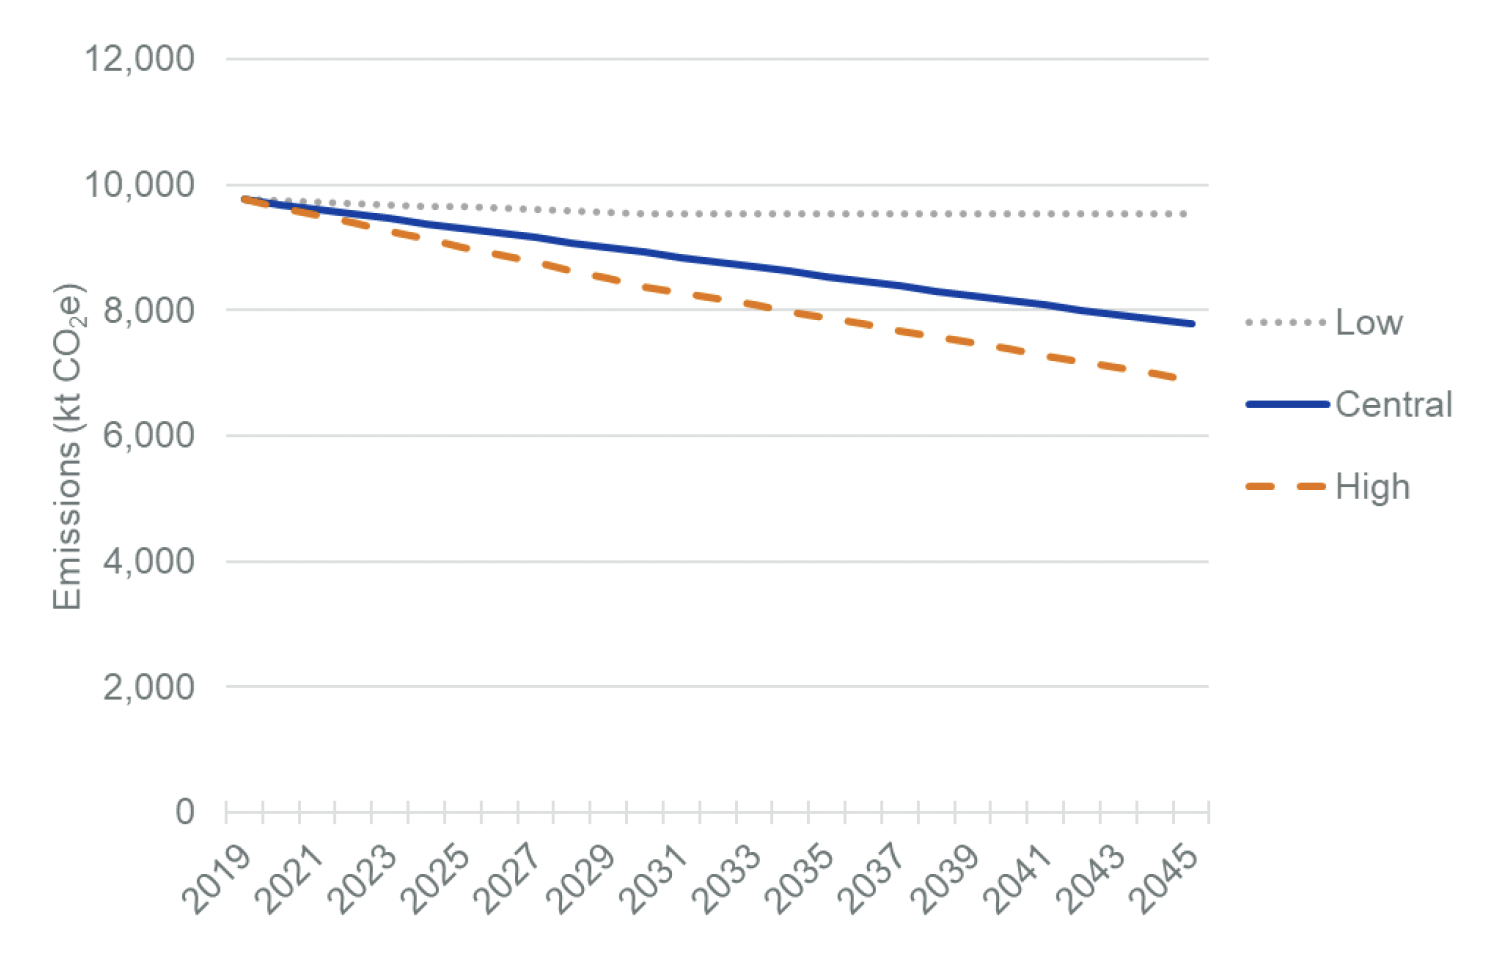
Historical peat extraction in Scotland for horticultural uses in compost has remained fairly steady over the last 30 years, with 1,106 and 1,082 ha of active horticultural peat production reported in 1990 and 2019, respectively (Brown et al. 2021, pers. comm.; Neil Bragg, chair of Growing Media Association, Jan. 2021). These areas are included above in the Central projection of onsite emissions from organic soils shown in Figure 12‑11.
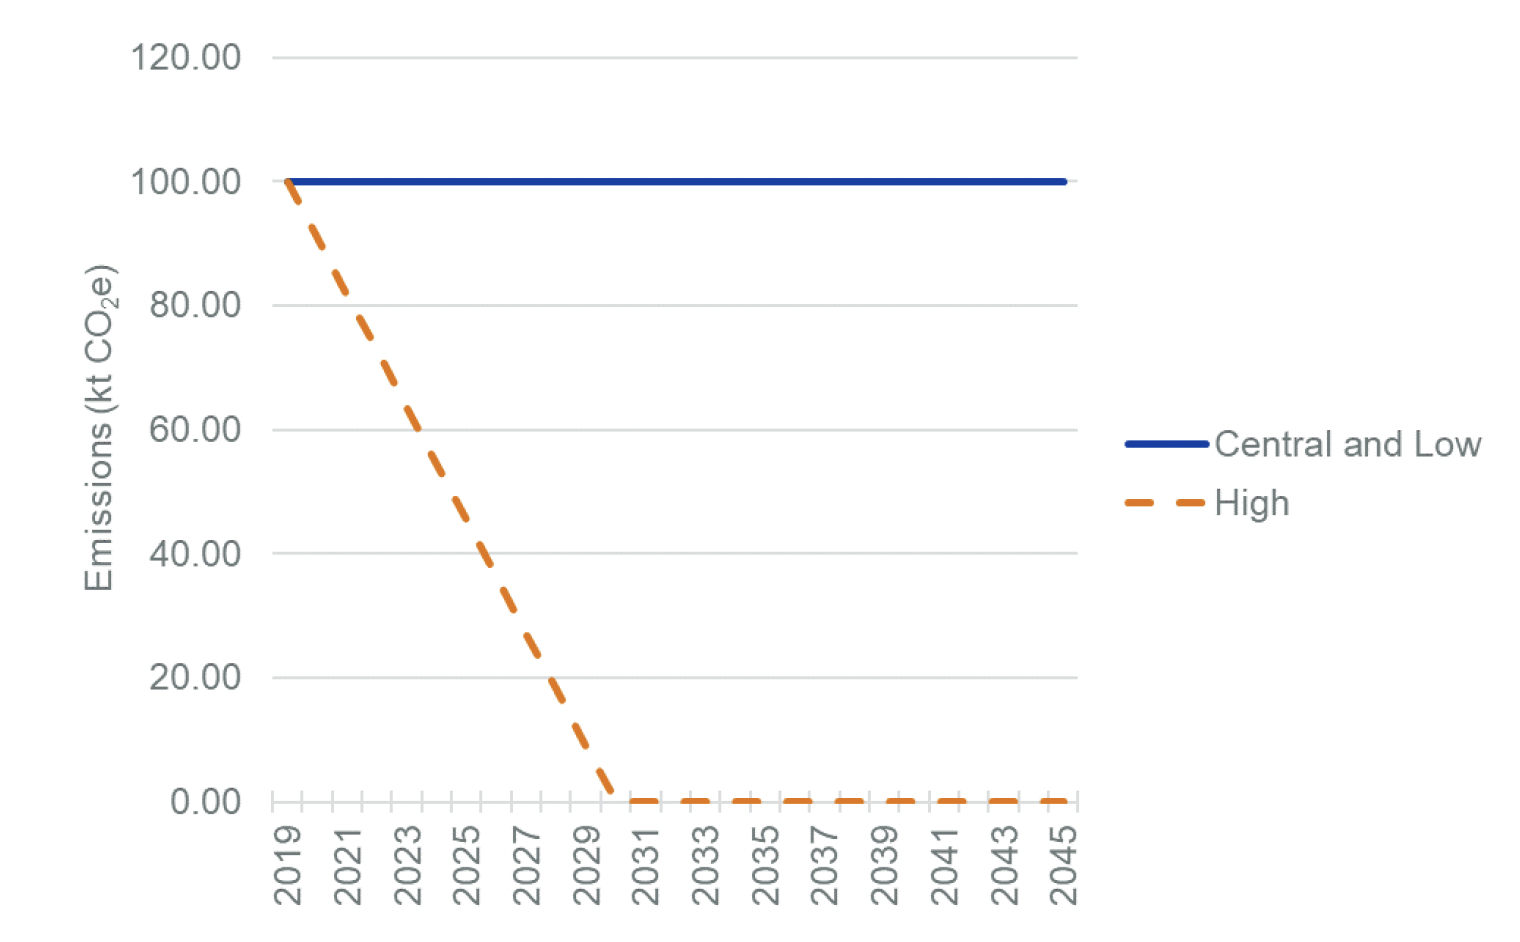
As stated above in the Policy 1 section, for the Central/Business-as-usual and Low growth projection we assume no restoration of active/operational extraction sites, resulting in zero reduction in carbon lost by oxidation of the harvested peat. In the High growth projection, all horticultural extraction sites are restored by 2030, reducing off-site emissions to zero by 2030 (Figure 12‑12).
The Scottish Government's National Planning Framework 4, adopted on 13 February 2023, sets out that new commercial peat extractions, including new extensions to existing sites will not be supported, except in exceptional circumstances and only then, when the peat to be extracted is supporting the whisky industry. In addition, the CCC (2021) report to the Scottish Parliament goes further, and recommends new legislation to ban the use of peat in compost. No licence information was available on peat extraction sites to indicate site closure dates in Scotland.
Offsite emissions from horticultural peat extraction are not included in Figure 12‑11, and so we present them separately in Figure 12‑12. Offsite emissions in 2019, estimated using a carbon density in wet peat of 0.0641 tC/m3 multiplied by the extracted peat volume of 425,372 m3 derived from the British Geological Survey UK Kingdom Minerals Year book (Brown et al. 2021), and converted to CO2 equivalents resulted in an emission of 99,980 t CO2 (Figure 0-8). Updated data from a Growing Media Association report (GMA 2021) used in the 1990-2020 inventory provides a lower estimate of 243,671 m3 (equivalent to an emission of 57,270 t CO2) from these sites in 2019 (Brown et al. 2022). However, for consistency with other data sources we have used the Brown et al (2021) extraction volumes as a conservative starting point for the projections.
Results are discussed in subsequent text
12.3.5 Policy 5: Our Position Statement on National Planning Framework 4 confirmed our current thinking that through the planning system we will not support applications for planning permission for new commercial peat extraction for horticultural purposes, we are looking at strengthening controls on development on peatland and we will help facilitate restoration through permitted development rights- Indicative assessment
Scotland's Fourth National Planning Framework is now adopted, which includes policy on restricting peat extraction on new commercial sites, and limiting renewals of licences on existing sites, with exceptions for industries of national importance or where there is no reasonable substitute. We suggest that this policy should be screened out at this stage as it is not possible to quantify associated impacts on GHG emissions, which would require detailed information on licencing agreements.
12.3.6 Proposal 1: Develop opportunities for private sector investment in peat restoration, engaging with sectors to establish investment pathways, enabling both public and private sector to invest in a range of measures to help mitigate effects of climate change- Indicative assessment
We suggest that this policy should be screened out at this stage as it is not possible to quantify associated impacts on GHG emissions, as far as the development of investment opportunities goes.
12.3.7 Proposal 2: Explore how best to restore all degraded peat in the public estate and also within formally designated nature conservation sites, including through statutory mandate. - Indicative assessment
We suggest that this policy should be screened out at this stage as it is not possible to quantify associated impacts on GHG emissions without an estimate of the area of degraded peat in the public estate (currently being undertaken by NatureScot).
12.3.8 Proposal 3: Explore the development of a Peatland Restoration Standard to ensure best practice and continuous development in the success and effectiveness of peatland restoration- Indicative assessment
We suggest that this policy should be screened out at this stage as it is not possible to quantify associated impacts on GHG emissions. NatureScot are developing a Technical Compendium that may provide the basis for the Peatland Restoration Standard.
12.4 LULUCF Outcome 4: We will establish pilot Regional Land Use partnerships
12.4.1 Policy 1: Establishment of pilot Regional Land Use Partnerships to help ensure that we maximise the potential of Scotland's land to help achieve net zero. Publication of Scotland's third Land Use Strategy. - Indicative assessment
Pilot Regional Land Use partnerships have been established (Highland Council Region, Cairngorms National Park, Loch Lomond and Trossachs National Park, North East Region and South of Scotland). We suggest that this policy should be screened out at this stage as it is not possible to quantify associated impacts on GHG emissions, although it will contribute to the delivery of other policies/proposals considered here. The CCPu Monitoring Compendium does not have indicators for this policy outcome.
12.5 Agriculture Outcome 6: Carbon sequestration and existing carbon stores on agricultural land have helped to increase and maintain our carbon sink
The CCPu Monitoring Compendium lists the indicators for this Outcome as on-track for area of woodland on agricultural land and off-track for hectares of peatland restored per year (see LULUCF Outcome 3/Policy 1).
12.5.1 Policy 1 - Explore with the farming and forestry sectors how best to increase planting of trees and hedgerows which optimise carbon sequestration, including the role of agroforestry. - Indicative assessment
The CCPu Monitoring Compendium describes progress in launching the Integrating Trees Network and funding additional support for integration of small woodlands on agricultural land. However, we suggest that this policy should be screened out at this stage as there is insufficient information to quantify direct impacts on carbon sequestration[64]. The commentary under LULUCF Outcome 1/Policy 3 also applies here. This policy will interact with other policies/proposals targeted at increasing tree planting on agricultural land.
12.5.2 Proposal 1 - Investigate the feasibility of payment for carbon sequestration taking into account any existing schemes such as the woodland carbon code as a means of encouraging the uptake of carbon sequestration on farms. - Indicative assessment
We suggest that this policy should be screened out at this stage as there is insufficient information to quantify direct impacts on carbon sequestration. The CCPu Monitoring Reports 2021 Compendium notes that a significant number of farmers are already selling carbon credits under the Woodland Carbon Code. This proposal is also lined to LULUCF Outcome 1/Policy 5.
12.5.3 Proposal 2 - Woodland cover on suitable agricultural land- Full assessment
Almost all forest creation occurs on agricultural land, some of it on pastures, and the majority on extensively grazed semi-natural grasslands. Therefore all woodland cover on suitable agricultural land is a subset of the woodland cover reported under LULUCF Outcome 1. The farm woodland area reported in Forestry Statistics reports are not clearly defined, and is likely to be a combination of grant-aided planting under other SFGS woodland creation options, non-grant aided planting/regeneration and variations in the area of farmland reported as woodland (which does not necessarily indicate a change in woodland area). The area planted under the "Small or Farm Woodland" option of the Scottish Forestry Grant Scheme is only 390 hectares since 2017 (473 hectares has been approved), and there has been none under the "Agroforestry" option.
In the 1990-2020 National GHG Inventory (Brown et al. 2022), for 2011-2020 an estimated 27.5% of Scottish annual woodland creation occurs on agricultural land (cropland and pasture land). This estimate comes from a land-use change dataset produced from data assimilation of multiple land-use/land-cover data sets (See Brown et al 2022 1990-2020 NIR). This proportion can be used to estimate the annual increase in woodland on agricultural land (Table 12‑8). These rates of woodland creation would give an additional 51,179 hectares of woodland cover on agricultural land by 2045. This represents 2% of the area of agricultural land (arable, mixed agriculture and improved grassland Land capability classes) potentially available for woodland expansion in Sing and Aitkenhead (2020).
| Year | Total annual woodland creation, ha/yr | Annual woodland creation on agricultural land, ha/yr |
|---|---|---|
| 2020 | 11,714 | 3,221 |
| 2021 | 13,125 | 3,609 |
| 2022 | 14,625 | 4,022 |
| 2023 | 16,125 | 4,434 |
| 2024 | 17,625 | 4,847 |
| 2025-2031 | 18,000 | 4,950 |
| 2032-2045 | 326 | 90 |
The estimated total net carbon sequestration from woodland creation on agricultural land by 2045 in the Central scenario is 3.3 Mt CO2e (4.4 Mt CO2e in the High growth scenario, and 2.4 Mt CO2e in the Low growth scenario). This assumes that woodland created on agricultural land has the same overall composition of species and yield classes as the total area of woodland creation.
12.5.4 Proposal 3 - Building on the successful work integrating woodland with farming businesses, help remove barriers for those on agriculture holdings, particularly in the tenanted sector who want to engage in woodland creation, including exploring the potential to reform legislation where appropriate. - Indicative assessment
The CCPu Monitoring Compendium reports that a working group on "Tenants and Trees" has been established and there is ongoing work in this area. Although an additional £1.5M has been made available to further support the integration of small woodlands on farms and crofts, further details are needed on how this will be spent and how success will be monitored (no current indicators associated with this proposal). We suggest that this policy should be screened out at this stage as there is insufficient information to quantify direct impacts on carbon sequestration.
12.5.5 Proposal 4 - Work with stakeholders on options to increase peatland restoration on suitable agricultural and crofting land, to support delivery of policies in the LULUCF chapter. We will map peatland against this land which will allow modelling options for land-use change and inform opportunities for targeted support of peatland restoration and management. - Indicative assessment
The CCPu Monitoring Compendium describes work underway to assess land use classifications, capability and the potential for restoring peatland which will inform the setting of a baseline and targets. We suggest that this policy proposal should be screened out at this stage as there is insufficient information to quantify associated impacts on GHG emissions.
12.5.6 Proposal 5 - Explore options for land-use change to optimise uses beyond traditional farming and food production to multi-faceted land use including forestry, peatland restoration and management and biomass production. - Indicative assessment
The CCPu Monitoring Compendium does not list any indicators for this proposal. Other proposals mention that work is underway to assess land use classifications and capability and links with the pilot Regional Land Use Partnerships (LULUCF Outcome 4) which will inform the setting of a baseline and targets for this proposal. We suggest that this policy proposal should be screened out at this stage as there is insufficient information to quantify associated impacts on GHG emissions.
12.6 Negative Emissions Technologies (NETs) Outcome 3: Bioenergy: a cross-sectoral approach for the appropriate and sustainable use of biomass in energy applications is agreed and implemented (taking into account competing land and feedstock uses)
12.6.1 Policy 2: In 2021, building on the Bioenergy Update, we will establishing a cross sectoral Bioenergy Expert Working Group to consider and identify the most appropriate and sustainable use for bioenergy resources across Scotland. It will also assess the volume of bioenergy resources that we can grow or produce within Scotland, and confirm the level of import that we believe is compatible with a sustainable global trade in bioenergy. - Indicative assessment
We suggest that this policy should be screened out at this stage as it is not possible to quantify the impact of the Bioenergy Expert Group on associated GHG emissions at this stage.
A Bioenergy Action Plan is due for completion by the end of 2022, and draft analysis/text/assumptions are not yet available. In discussion, the policy contacts in the sector expressed concern that analysis of potential GHG mitigation in this project could contradict and undermine the more detailed analysis that will be published with the Bioenergy Action Plan.
Net emissions from combustion of bioenergy crops would be reported under the Energy sector of the national GHG Inventory. However, carbon sequestration in the biomass of perennial bioenergy crops such as Miscanthus grass and short-rotation coppice and the soils would be reported in the LULUCF sector, and could constitute an additional carbon sink, depending on the management employed (see Thomson et al. 2021 for worked examples).
12.7 Adjustments required to match 1990-2020 GHG inventory
The estimated emissions from the policies are for activities from 2020 onwards. They do not include other LULUCF emissions from historic land management and land-use change[65], which will continue to contribute to overall LULUCF GHG emissions between 2020 and 2050. Projected emissions to 2050 for the LULUCF sector have been calculated based on the 1990-2019 inventory, but equivalent projections are not available for the 1990-2020 inventory. Methodological changes in the 1990-2020 inventory mean that it is not possible to use the 1990-2019 projections without adjustments.
The adjustments required to ensure consistency between the policy emissions and the 1990-2020 inventory are as follows:
- Replacing the estimated peatland policy emissions for 2019 and 2020 in the Central, Low and High scenarios with the appropriate values (by source) from the 1990-2020 inventory.
- Including the other LULUCF net emissions arising from historic land management and land-use change from 2021 onwards. Adjustments have been applied for each land category and GHG combination based on the difference in values for 2020 between the projections based on the 1990-2019 inventory and the 1990-2020 inventory. The additional sources/sinks are:
- Net carbon stock changes and emissions from existing forests on mineral soils and biomass carbon stock change in existing forests on organic soils;
- Net carbon stock changes and emissions from cropland, grassland and settlement on mineral soil due to land use change and land management;
- Offsite emissions from horticultural peat, emissions from grassland converted to flooded land (on mineral soil), biomass burning and biomass losses from rewetted forests;
- Emissions from biomass burning (wildfires and controlled burning due to deforestation) on forest, cropland and grassland;
- Emissions from changes in the harvested wood products pool (from existing forests); and
- Indirect N2O emissions from the LULUCF sector.
- A small adjustment to net carbon stock change from existing forests in 2019 (3 kt CO2e) and 2020 (12 kt CO2e) was added to account for methodological differences between the inventory and the projection calculations.
The net peatland emissions include N2O emissions from intensive agriculture (cropland and improved grassland). Under the IPCC reporting framework for the national GHG inventory these emissions (227 kt CO2e) are reported under the Agriculture sector rather than the LULUCF sector.
There remains a large jump in the net emissions timeseries post-2021. This is due to the implementation of Tier 2 emission factors for forest on organic soils in the policy projections: the national GHG inventory and the 1990-2019-based projections use the CARBINE method (see further discussion in the text under LULUCF Outcome 3/Policy 1. The Tier 2 EF is higher and static over time, compared with the CARBINE method which takes account of forest growth and inputs and produces a variable implied emission factor. We would recommend that the Scottish Government commission further analysis using either the CARBINE model, or an improved proxy method, including a comparison of model uncertainties, to resolve these inconsistencies.
12.8 Approach to align the LULUCF projections with the SG GHG projections model
In the overall Scottish Government Projections model, an offset of -4073.866 kt CO2e is applied to output of the LULUCF modelling work from 2021 onwards to remove this large jump in emissions and to provide a smooth emissions trajectory that allows a partial comparison with the Scottish Sector Emissions Envelope for LULUCF.
This offset was applied by the Ricardo modelling team.
12.9 References
Alderson, D.M., Evans, M.G., Shuttleworth, E.L., Pilkington, M., Spencer, T., Walker, J. and Allott, T.E. (2019). Trajectories of ecosystem change in restored blanket peatlands. Science of the Total Environment, 665, 785-796.
Brown et al. 2021 UK Greenhouse Gas Inventory, 1990 to 2019: Annual Report for submission under the Framework Convention on Climate Change. https://unfccc.int/documents/273439
Brown et al. 2022 UK Greenhouse Gas Inventory, 1990 to 2020: Annual Report for submission under the Framework Convention on Climate Change https://unfccc.int/documents/461922
Climate Change Plan Update 2018-2032 (2020) https://www.gov.scot/publications/securing-green-recovery-path-net-zero-update-climate-change-plan-20182032/
CCC (2021). Progress in reducing emissions in Scotland. 2021 Report to Parliament.
CCC (2022). Is Scotland climate ready. 2022 Report to Scottish Parliament.
https://www.theccc.org.uk/wp-content/uploads/2021/12/Progress-reducing-emissions-in-Scotland-2021-Report-to-Parliament-1.pdf
Climate Change Plan Monitoring Reports 2022 Compendium (2022) https://www.gov.scot/binaries/content/documents/govscot/publications/progress-report/2022/05/climate-change-plan-monitoring-reports-2022/documents/climate-change-plan-monitoring-reports-2022/climate-change-plan-monitoring-reports-2022/govscot%3Adocument/climate-change-plan-monitoring-reports-2022.pdf
Evans, C., Artz, R., Burden, A., Clilverd, H., Freeman, B., Heinemeyer, A., Lindsay, R., Morrison, R., Potts, J., Reed, M., Williamson, J. (2022). Aligning the Peatland Code with the UK Peatland Inventory. Final Report to DEFRA. Defra, UK - Science Search.
FGS Statistics Summary- Clearing Round 75 (28/01/2022) https://forestry.gov.scot/publications/support-and-regulations/forestry-grant-scheme/forestry-grant-scheme-statistics
GMA (2021). Growing media monitor. Trends in the composition of UK growing media supplied 2011 to 2019. https://hta.org.uk/associations-committees-groups/growing-media-association
Kerkvliet-Hermans, R. (2020). Wood in construction, a policy and data summary. https://edinburghcentre.org/uploads/store/mediaupload/668/file/Wood%20in%20construction,%20a%20policy%20and%20data%20summary.pdf
Lees, K.J., Artz, R.R.E., Chandler, D., Aspinall, T., Boulton, C.A., Buxton, J., Cowie, N.R., Lenton, T.M. (2021). Using remote sensing to assess peatland resilience by estimating soil surface moisture and drought recovery. Science of the Total Environment, 761, p.143312.
NatureScot (2015). Scotland's National Peatlands Plan: Working for our future. https://www.nature.scot/doc/scotlands-national-peatland-plan-working-our-future
Nugent, K.A., Strachan, I.B., Roulet, N.T., Strack, M., Frolking, S. and Helbig, M. (2019). Prompt active restoration of peatlands substantially reduces climate impact. Environmental Research Letters, 14(12), p.124030.
Perks et al. (2018) Agroforestry in Scotland- potential benefits in a changing climate. https://www.climatexchange.org.uk/research/projects/agroforestry-in-scotland-potential-benefits-in-a-changing-climate/
Scottish Forestry Grant Scheme https://forestry.gov.scot/support-regulations/forestry-grants
Staddon et al. (2021). Encouraging woodland creation, regeneration and tree planting on agricultural land: a literature review. Natural England Evidence Review NEER020. http://publications.naturalengland.org.uk/
Thomson, A., Evans, C., Buys, G., and Clilverd, H. (2021). Updated quantification of the impact of future land use scenarios to 2050 and beyond. Final report to Committee on Climate Change. https://www.theccc.org.uk/publication/updated-quantification-of-the-impact-of-future-land-use-scenarios-to-2050-and-beyond-uk-centre-for-ecology-and-hydrology/
UKCEH (2021) LULUCF GHG emission projections for the 1990-2019 inventory (submitted to BEIS but not yet published) https://naei.beis.gov.uk/reports/
Department for Energy Security and Net Zero (2021) Energy and emissions projections: Net Zero Strategy baseline (partial interim update December 2021. https://www.gov.uk/government/publications/energy-and-emissions-projections-net-zero-strategy-baseline-partial-interim-update-december-2021
Woodland Carbon Code Calculator (2021) https://www.woodlandcarboncode.org.uk/standard-and-guidance/3-carbon-sequestration/3-3-project-carbon-sequestration
Contact
Email: Edward.Mchardy@gov.scot
There is a problem
Thanks for your feedback