Greenhouse gas emissions projections: phase 1 and phase 2 modelling results
Analysis undertaken by Ricardo-AEA for the Scottish Government to provide an estimated projection of Scottish emissions from 2019 to 2045 which capture announced Scottish and UK policies.
4. Agriculture sector
4.1 Sector Overview
4.1.1 Sector Background
The Agriculture sector is a complex, diverse sector employing around 67,000 people in Scotland and covering nearly 80% of Scotland's land mass. In 2018, the total income from farming was £672m[7], with agriculture contributing 0.8% to the gross value added (GVA) at basic prices. In 2020, agriculture contributes 18%[8] of Scotland's total greenhouse gas emissions with significant emissions of CH4 and N2O, some emissions of CO2 and removals of CO2 by sinks. There are strong linkages with the LULUCF and energy sectors through inter-related needs from the land, such as forestry, peatland restoration, biodiversity creation, growing biomass for energy generation, food and alcohol production and recreation.
Unlike other sectors, non-CO2 GHG emissions are a major share of GHG emissions. These non-CO2 emissions are mainly N2O emitted from soil following the application of fertiliser and manures, and emissions of CH4 produced from enteric fermentation and manure management.
4.1.2 Subsectors Considered
The subsectors modelled are based on the subsectors of the GHG inventory for agriculture. The subsectors are listed below with some notes on the inclusions in each.
- Livestock
- Includes enteric fermentation from dairy and non-dairy cattle, sheep, pigs and other livestock; emissions from management of manure, but not including soil emissions after manure application to land.
- Crops, including:
- emissions following application of inorganic N (nitrogen) fertilisers, animal manure and sewage sludge to soils,
- direct emissions from digestate,
- emissions from pasture grazed by livestock,
- emissions from crop residues,
- emissions following mineralisation associated with loss/gain of soil organic matter,
- emissions following cultivation of organic soils,
- emissions following atmospheric deposition and nitrogen leaching and run-off,
- emissions from liming and urea application
- emissions from field burning are accounted for in this category but are assumed to not occur in Scotland.
- Other agriculture
- Fuel combustion and other energy use. This is 10% of emissions from agriculture.
4.1.3 Data Sources
The main data sources used to undertake the assessment of the Agriculture sector are detailed below.
| Purpose | Data used | Comment |
|---|---|---|
| GHG inventory for Scotland | UK National Atmospheric Emissions Inventory (UK NAEI) | GHG inventory for Scotland needed to estimate impacts of policies on emissions. |
| Agricultural activity projections | The main activity data sources were:
|
We used these data sources to estimate projected trends in both animal numbers and N use |
4.1.4 Underlying Drivers of Energy & Emissions
For agricultural emissions, the main underlying drivers are livestock numbers and fertiliser use. We looked at past trends and created a rolling average over 3 years to create a future trend for each of the livestock types. There were differences between the livestock types with growth in camelids and deer, for example, but the total numbers of these were small in comparison to sheep and cattle numbers, and therefore trivial in terms of GHG emissions.
For fertiliser use data, the trends do not include the impact of war in Ukraine or recent high fertiliser prices, as values were available only up to 2019.
4.2 Policy Measures and Outcomes Modelled
4.2.1 Phase 1 – Policy Measures
All the Agriculture sector policies for which we could identify quantifiable evidence for impacts on agricultural practices and emissions (or supporting a policy for which this could be identified) were grouped into a package (A1). The other policies were deemed unquantifiable (and also not supporting a quantifiable policy), as baseline emissions could not be determined, and/or they contained no tangible targets. The policies and proposals in the package A1 are given in Table 4‑2.
For the assessment of Outcome 1, Policy 1 (see Table 4‑2) which refers directly to the Agricultural Transformation Programme, we used a report by SAC consulting[9] on the GHG savings attributed to the capital investments resulting from the Agricultural Transformation Programme piloted from autumn 2020. We used the estimated value of 6% emissions savings for this pilot programme. The report estimates this only for beef farming as this is the only sector they had a baseline for, but we believe similar savings could be found in the dairy industry as it covers similar manure management and animal welfare techniques. Better manure management also has the potential to reduce inorganic fertiliser use in the arable sector.
The other policies and proposals (such as training and advice) that we included in package A1 support the intended impacts of Outcome 1, Policy 1 and we believe would continue to do so if the pilot programme were to be repeated. With the currently available data, it is not possible to allocate specific GHG reductions to these actions, but it is feasible that without them the potential savings from the Agricultural Transformation Programme would not be made or sustained since these savings are based on improved expertise and frequency of use of the equipment. This includes, for example, Outcome 2, Policies 1-3, on increasing understanding of the importance and potential of climate action in the farming sector. These other policies and proposals (in particular Outcome 3, Policies 1-3) will have direct GHG savings beyond the livestock subsector but in this project, GHG savings can be allocated only to the livestock subsector because of the available baseline data provided by the SAC report.
It was not possible to quantify the impacts of the other policies as they did not have baselines or numerical targets.
| Outcomes | Policies and proposals |
|---|---|
| Outcome 1: A more productive, sustainable Agriculture sector that significantly contributes towards delivering Scotland's climate change, and wider environmental, outcomes through an increased uptake of climate mitigation measures by farmers, crofters, land managers and other primary food producers | Policy 1: Scale up the Agricultural Transformation Programme across all the policies, including monitoring to assess the effectiveness of the pilot Sustainable Agricultural Capital Grant Scheme that will enable farmers and crofters to purchase equipment that should assist in reducing their greenhouse gas emissions, and support practice change |
| Proposal 1: Develop rural support policy to enable, encourage and where appropriate, require the shift to low carbon, sustainable farming through emissions reduction, sustainable food production, improving biodiversity, planting biomass crops and appropriate land use change developed in line with just transition principles. | |
| Outcome 2: More farmers, crofters, land managers and other primary food producers are aware of the benefits and practicalities of cost-effective climate mitigation measures. | Policy 1: The dissemination of information and advice on climate change mitigation measures in agriculture through a range of communication methods utilising technology and all media to best effect. |
| Policy 2: An agri-tech group will be established to share, disseminate and encourage adoption of advances in agricultural science and technology as widely as possible. | |
| Policy 3: Launch a new and expanded peer to peer knowledge transfer initiative based on the success of our Young Climate Change Champions work. | |
| Proposal 1: Carbon Audits: in 2018, we will consult on how best to ensure maximum take up of carbon audits and how to enable tenant farmers and crofters in particular to benefit. | |
| Proposal 2: We will explore with stakeholders, including the Scottish Tenant Farmers Association and the Tenant Farming Commissioner, how best to engage tenant farmers to increase understanding of the environmental and economic benefits of low carbon farming. |
| Outcomes | Policies and proposals |
|---|---|
| Outcome 3: Nitrogen emissions, including from nitrogen fertiliser, will have fallen through a combination of improved understanding, efficiencies and improved soil condition | Policy 1: Communicate and demonstrate the benefits of precision farming and nitrogen use efficiency in order to achieve a reduction in GHG emissions. |
| Policy 2: Work with the agriculture and science sectors regarding the feasibility and development of a SMART (specific, measurable, achievable, relevant and time bound) target for reducing Scotland's emissions from nitrogen fertiliser. | |
| Policy 3: From 2018 we expect farmers to test the soil on all improved land every five or six years, and we will work with them to establish how best to achieve this. |
Most policies and proposals did not have tangible targets or actions that will lead to quantifiable GHG impacts. For example, some were about provision of information or advice, and others involved investigating how mitigation actions could be implemented. Thus an analysis of the policy development assumptions was undertaken. The CCPu for agriculture was reviewed to identify all the GHG mitigation measures referred to directly or indirectly inferred to in our judgement of how policy aspirations could be implemented.
We estimated the GHG mitigation potential for each of the measures identified. This was informed by Lampkin et al. (2019), Eory et al. (2021), together with our own previous work (including our work to review agricultural GHG mitigation actions for the European Commission). This was backed up by a rapid evidence assessment (REA) to fill any knowledge gaps.
Using these various information sources, we estimated a mitigation potential per ha or livestock head using relevant area/headage factors. We scaled up the estimates to Scottish national level using the Scottish agricultural census data (Scottish Government; 2020a) to identify the maximum potential for individual measures that could be quantified. Average values over the period 2015 to 2020 were used.
We then estimated annual additional uptake potential for each mitigation action. Data on current uptake of mitigation actions in the UK and in Scotland are incomplete. Some data are available from government surveys by Defra and the Scottish Government but estimates of the likely uptake above the existing levels of uptake required expert judgement. In doing this we have drawn upon our experience of providing estimates of mitigation action uptake for the European Commission and used literature evidence where available.
The combined effects of mitigation actions at a Scottish level are not the same as the sum of the mitigation potentials for each action. This is because not all mitigation actions are independent of each other: for example, adoption of one mitigation action can affect the uptake of another mitigation action. Therefore, we assessed all mitigation actions for interactions and those that are not independent were placed into groups. We then estimated the mitigation potential for the group, and sub-sets of the group.
4.2.2 Phase 2 – Outcomes
The additional modelling undertaken during Phase 2 consisted of updates to the modelling assumptions, rather than a change in the overall level of ambition. Key changes to the modelling, as identified during the Phase 2 sector workshop, are summarised below.
The Scottish Government requested the team to reflect in the modelling improved uptake estimates for better nitrogen use and manure practices to reflect changes in the General Binding Rules on Silage and Slurry[10], a further round of the Capital Grant Scheme, and some allowance for methane breeding potential post 2030. These three elements had developed since the original CCP update was published. Furthermore, the Scottish Government, in their Vision for Agriculture, state that they will integrate enhanced conditionality (on climate and nature) of at least half of all funding for farming and crofting by 2025. The conditions are not yet defined, but there is expected to be a focus on management measures, with benefits for reduced climate impact. Another element is preparing for sustainable farming, with measures such as support and uptake for soils testing and carbon audits, but it is not clear, quantitatively, what these will deliver.
Other changes expected to impact GHG emissions projections include the following.
- 'My Herd Stats' will provide more accessible data to livestock farmers- starting with dairy and beef.
- Amendments to the Water Environment (Controlled Activities) (Scotland) Regulations 2011, on storage and use of slurry and digestate, are being implemented in a phased approach, starting from 1 January 2022, with particular rules on using LESS (low emission slurry spreading) equipment from 1 January 2023.
- There will be a further round of the capital grant scheme focusing on storage covers and precision farming equipment.
- There is a Scottish Government Programme for Government (PfG) commitment to double the organic production area.
- Peer-to-peer learning and other knowledge transfer are being encouraged, albeit with a recognition that the outcomes are uncertain; this includes the Small Woodland Loan Scheme, the Agriculture, Biodiversity and Climate Change Network, and the Integrating Trees Network scheme.
Only one take-up scenario was considered, consisting of improved uptake estimates for better nitrogen use and manure practices so as to reflect changes in the General Binding Rules on Silage and Slurry, a further round of the Capital Grant Scheme, and some allowance for methane breeding potential post 2030, as noted above.
4.2.3 Summary of Policy Packages
The table below indicates which policies were found to have the biggest potential impact within each package, which policies overlap with (or reinforce) each other, and which policies act as supporting measures.[11]
As explained previously, the emissions reductions that have been quantified for the agriculture sector are primarily due to Outcome 1, Policy 1 which is to scale up the Agricultural Transformation Programme. The other policies in the CCPu are considered supporting measures and could not be quantified separately. The table below presents the full suite of policies included in package A1.
In addition to the CCPu policies, which were grouped into Package A1, this study also drew on evidence from a separate report, produced by Ricardo on behalf of the World Wide Fund for Nature (WWF). It is important to note that the WWF study was part of a separate piece of work and that it is not a CCPu policy; however, in agreement with Scottish Government, it has been used as evidence to support this analysis. For more information refer to Section 4.3.4.
| Policy | Categorisation |
|---|---|
| Policy 1: Scale up the Agricultural Transformation Programme across all the policies, including monitoring to assess the effectiveness of the pilot Sustainable Agricultural Capital Grant Scheme that will enable farmers and crofters to purchase equipment that should assist in reducing their greenhouse gas emissions, and support practice change | Key policy |
| Proposal 1: Develop rural support policy to enable, encourage and where appropriate, require the shift to low carbon, sustainable farming through emissions reduction, sustainable food production, improving biodiversity, planting biomass crops and appropriate land use change developed in line with just transition principles. | Supporting measure |
| Policy 1: The dissemination of information and advice on climate change mitigation measures in agriculture through a range of communication methods utilising technology and all media to best effect. | Supporting measure |
| Policy 2: An agri-tech group will be established to share, disseminate and encourage adoption of advances in agricultural science and technology as widely as possible. | Supporting measure |
| Policy 3: Launch a new and expanded peer to peer knowledge transfer initiative based on the success of our Young Climate Change Champions work. | Supporting measure |
| Proposal 1: Carbon Audits: in 2018, we will consult on how best to ensure maximum take up of carbon audits and how to enable tenant farmers and crofters in particular to benefit. | Supporting measure |
| Proposal 2: We will explore with stakeholders, including the Scottish Tenant Farmers Association and the Tenant Farming Commissioner, how best to engage tenant farmers to increase understanding of the environmental and economic benefits of low carbon farming. | Supporting measure |
| Policy 1: Communicate and demonstrate the benefits of precision farming and nitrogen use efficiency in order to achieve a reduction in GHG emissions. | Supporting measure |
| Policy 2: Work with the agriculture and science sectors regarding the feasibility and development of a SMART (specific, measurable, achievable, relevant and time bound) target for reducing Scotland's emissions from nitrogen fertiliser. | Supporting measure |
| Policy 3: From 2018 we expect farmers to test the soil on all improved land every five or six years, and we will work with them to establish how best to achieve this. | Supporting measure |
| Policy | Categorisation |
|---|---|
| Additional potential actions as per an earlier report produced for the WWF | N/A |
4.2.4 Variation across scenarios
Due to the inelastic nature of the core food and drink products from Scotland coupled with high export reliance, the scenarios explored under this work are deemed not applicable to the Agriculture sector. However, some minor variation in projected emissions can be seen between scenarios under Phase 1 – this is to do with assumed variation in uptake of the main quantified policy for the Agriculture sector (Agricultural Transformation Fund) according to economic growth scenario, as this is a funding driven policy.
4.3 Emissions Projections
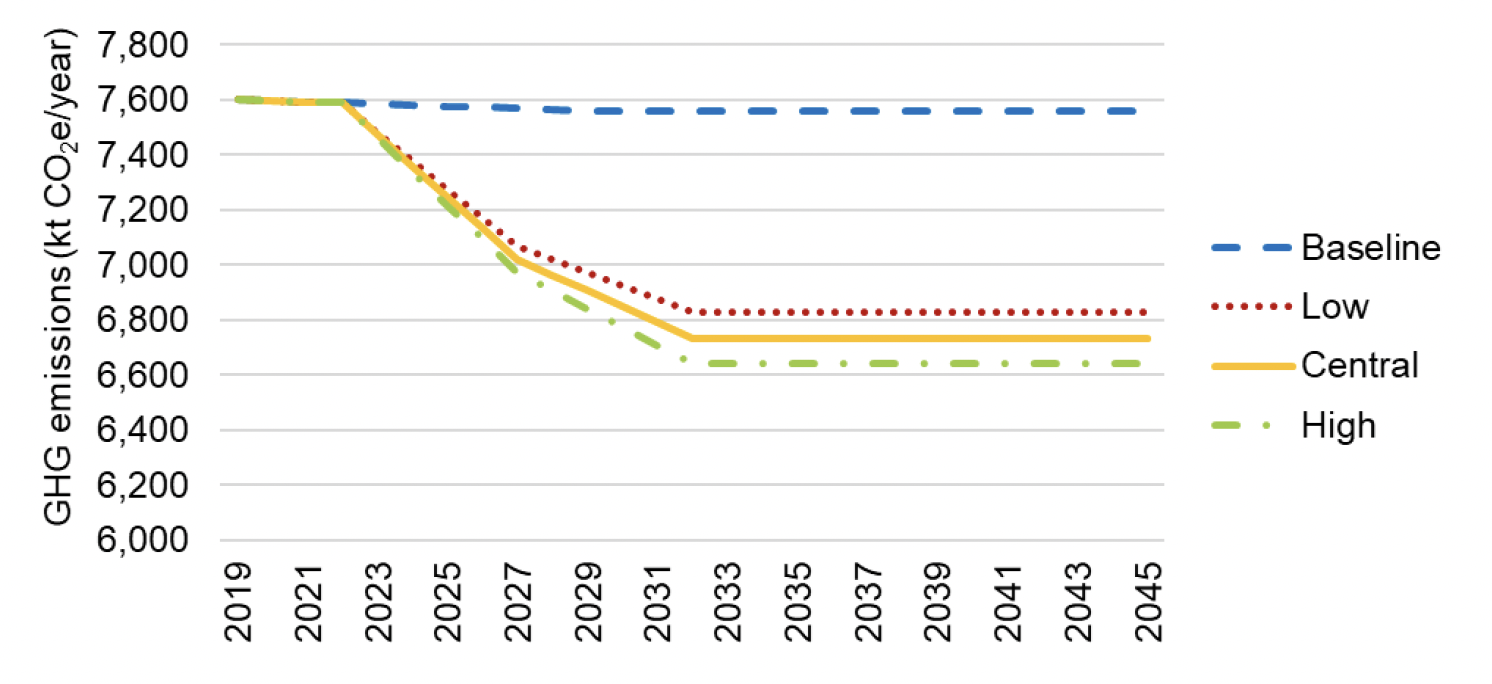
4.3.1 Phase 1 results
Total CO2 emissions from the Agriculture sector shown in Figure 4‑1 are expected to decline from nearly 7.6 Mt CO2 in 2019 to between 6.6 and 6.8 Mt CO2 by 2032 based on estimated outcomes of the policies in Table 4‑2. The remaining emissions sources will be, like today, mainly methane from livestock (enteric fermentation) and their manures, and nitrous oxide from soil.
4.3.2 Phase 2 results
The additional modelling work resulted in changes in the modelling outputs, as shown in Figure 4‑2; this modelling was based on only one take-up scenario. The expected increase in activity on improving nutrient and manure use efficiency reflecting the stepped introduction of the new General Binding Rules for example, produces a reduction in GHG emissions, as shown in
Figure 4‑3, and Table 4‑6 quantifies these results. You will notice there is a levelling-off of results after 2030 as improved behaviours of nitrogen and manure management can only go so far before impacting production.
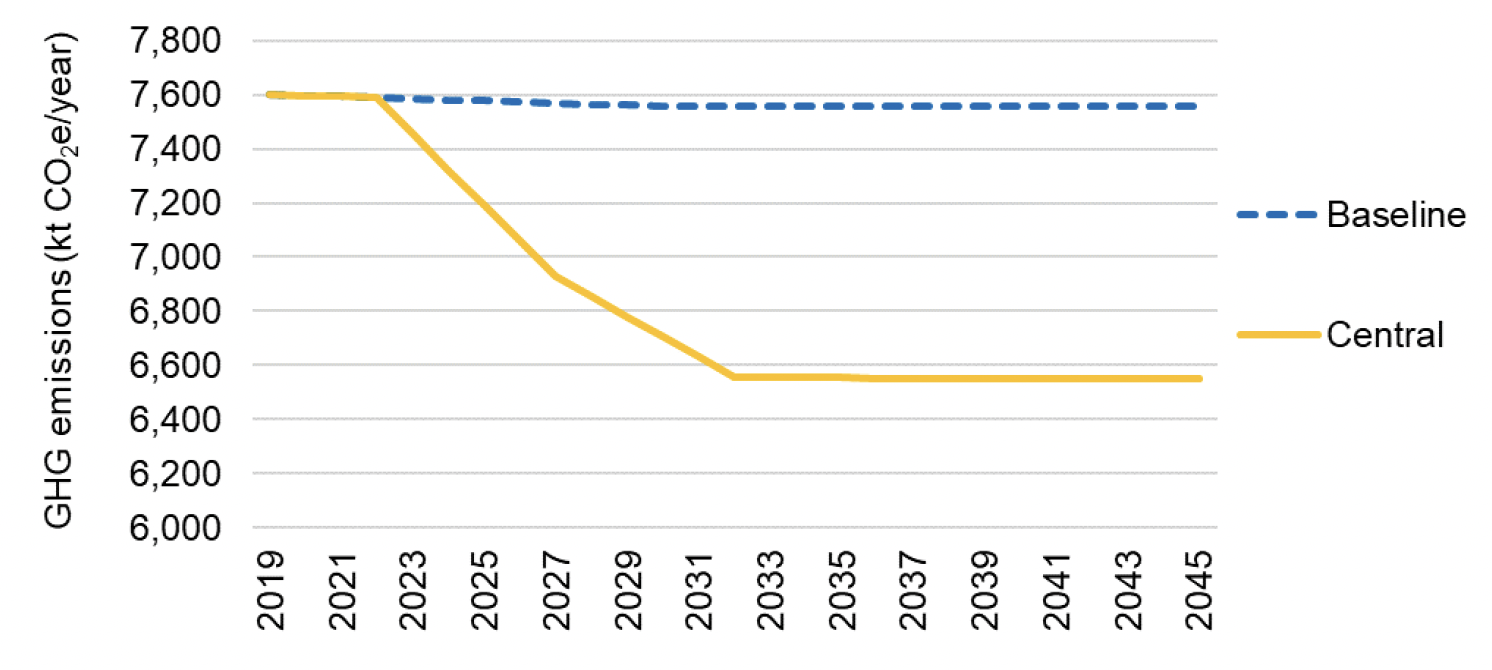
It is worth noting that due to the interrelated nature of farming systems, different policy packages will have impacts on each other and are therefore difficult to identify a particular allocation of savings. For example, an improved advice and knowledge system will support the implementation of best practice, as will availability of funding for better technical equipment. However, neither of these policies can guarantee best practice. The transitional changes to the General Binding Rules are expected to have the most impact.
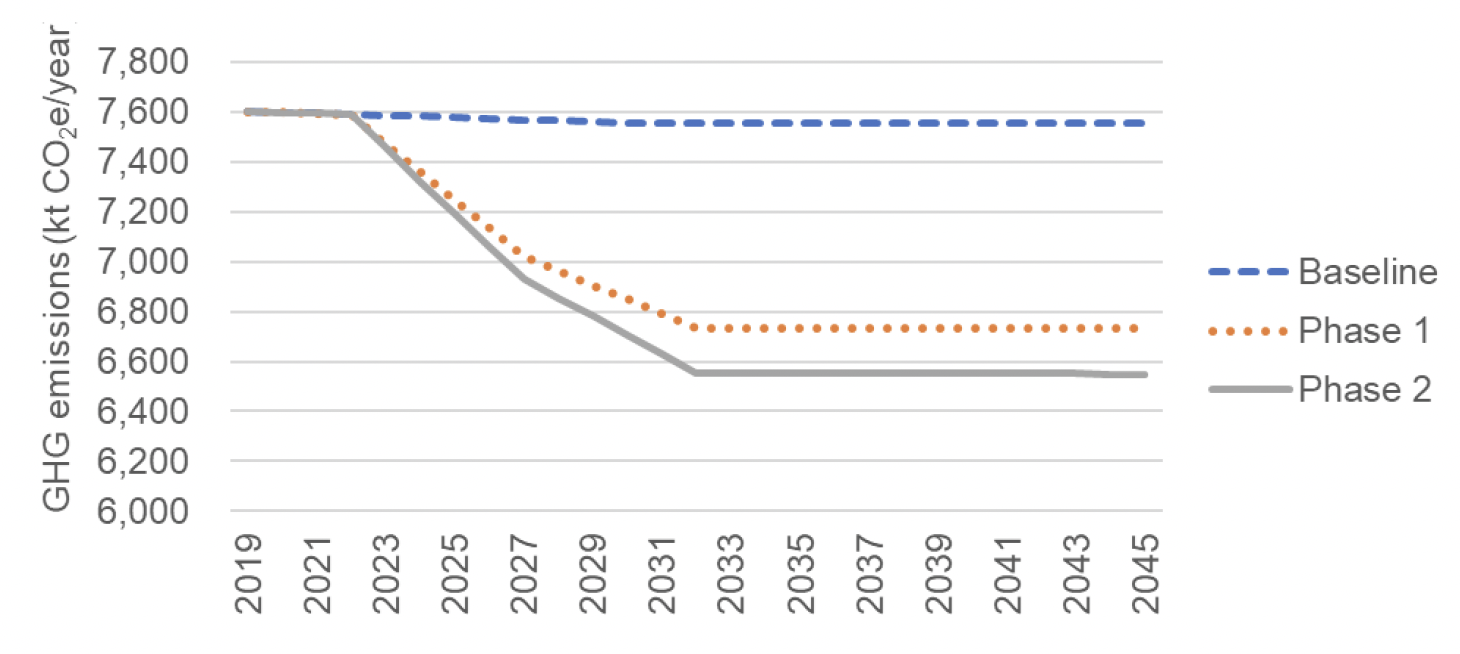
4.3.3 Comparison of Phases 1 & 2
Figure 4‑3 shows the difference in estimates of emissions between Phases 1 (central scenario) and 2 of the project and the 2019 baseline. As stated previously, the difference between Phases 1 and 2 is due to changes in the modelling assumptions rather than changes in the overall level of ambition that was assumed. Table 4‑6 provides more detail on the individual take-up scenarios and their estimated changes over time compared to the single take-up scenario estimated in Phase 2.
| Phase | Scenario | Emissions (ktCO2e) | ||||||
|---|---|---|---|---|---|---|---|---|
| 2019 | 2020 | 2025 | 2030 | 2035 | 2040 | 2045 | ||
| Baseline | 7,601 | 7,597 | 7,577 | 7,557 | 7,557 | 7,557 | 7,557 | |
| 1 | Central Growth | 7,601 | 7,597 | 7,243 | 6,850 | 6,734 | 6,734 | 6,734 |
| High Growth | 7,601 | 7,597 | 7,214 | 6,774 | 6,639 | 6,639 | 6,639 | |
| Low Growth | 7,601 | 7,597 | 7,271 | 6,925 | 6,828 | 6,828 | 6,828 | |
| 2 | Central Growth | 7,601 | 7,597 | 7,188 | 6,707 | 6,554 | 6,551 | 6,550 |
| High Growth | 7,601 | 7,597 | 7,188 | 6,707 | 6,554 | 6,551 | 6,550 | |
| Low Growth | 7,601 | 7,597 | 7,188 | 6,707 | 6,554 | 6,551 | 6,550 | |
4.3.4 Emissions reduction by policy package (2032) – Phase 1 & 2
This section presents results on the emission reductions of each policy outcome considered in the model. The table below provides a further breakdown of the estimated emissions from policy package A1 which focused on the Capital Grant Scheme, and new policies such as the changes to the binding rules for water.
| Policy Package | Emissions reductions by 2032 (ktCO2e) | |||||
|---|---|---|---|---|---|---|
| Phase 1 | Phase 2 | |||||
| Central Growth | High Growth | Low Growth | Central Growth | High Growth | Low Growth | |
| A1 | -244 | -244 | -244 | -244 | -244 | -244 |
| Total | -244 | -244 | -244 | -244 | -244 | -244 |
Further emissions reductions have been included from potential mitigations as part of CCPu agricultural policies as estimated from the WWF "Reaching Net Zero in Scotland" report[12]. The WWF study (Wiltshire et al., 2021) assessed the potential for GHG emissions mitigation in agriculture, by 2032, that could arise from implementation of recommendations in other reports, including the Scottish Government's Climate Change Plan Update (CCPu). Recognising that the CCPu proposed policies and actions that are mainly to explore further policies to drive uptake of mitigation actions, an interpretation was made of how CCPu policies and actions could lead to on-farm mitigation actions by 2032. The WWF report concluded that the mitigation potential, based on an interpretation of the CCPu, was not sufficient to reach the CCPu GHG mitigation target (for 2032) of 5.3 Mt CO2e y-1. Further conclusions included:
- The extent of GHG emissions mitigation will be dependent on both the quality of mitigation action implementation and the extent to which additional mitigation action uptake is achieved.
- A further challenge in the pursuit of the CCPu target is the availability of data; better and more activity data (e.g., from farm surveys) will be needed to monitor progress, including uptake of mitigation actions.
4.4 Uncertainties
In our judgement, uncertainties in the historical estimates of emissions are high relative to other sectors, and uncertainties in projections of GHGs are even higher.
4.5 Sensitivities
The projected GHG emissions for agriculture in Scotland are sensitive to ruminant livestock population (mainly sheep and cattle) because ruminant livestock population is the main driver of enteric fermentation and the associated emission of methane. Enteric fermentation emissions dominate agriculture GHG emissions in Scotland.
Emissions of nitrous oxide from soil are also a major component of the GHG emissions total for agriculture in Scotland, and projections of these emissions are sensitive to nitrogen inputs to land, including inorganic (manufactured) nitrogen fertiliser and organic nitrogen inputs such as livestock manures.
Contact
Email: Edward.Mchardy@gov.scot
There is a problem
Thanks for your feedback