Greenhouse gas emissions projections: phase 1 and phase 2 modelling results
Analysis undertaken by Ricardo-AEA for the Scottish Government to provide an estimated projection of Scottish emissions from 2019 to 2045 which capture announced Scottish and UK policies.
8. Transport sector
8.1 Sector Overview
8.1.1 Sector Background
Transport was the largest emitting sector in Scotland in 2019, with around 13.95 million tonnes of CO2e (including international bunkers)[46]. The National Transport Strategy 2, published in 2020, defines climate change as one of the four priorities in the transport sector for the next two decades. The deployment of sustainable and low carbon energy sources in the transport sector is a key focus area with deployment paces tailored to the varying level of technological maturity across transport modes. In addition, travel behaviour and transport demand management measures are also seen as necessary steps towards the net zero pathway by 2045. Transport infrastructure investment will also be planned consistently to limit traffic increases generated by any capacity expansion. A recent study commissioned by Transport Scotland in 2021, Decarbonising the Scottish Transport Sector, assessed several policy scenarios and their capacity to meet Scotland´s emission targets.
The climate change plan update (CCPu) sets the following key commitments by 2032:
- No new petrol and diesel cars and vans.
- Work to decarbonise challenging transport modes, such as HGVs, ferries and aviation will have started.
- Car kilometres will have reduced by 20%.
- Research into biofuels and hydrogen will have stimulated private investment and innovation.
- Almost complete decarbonisation of passenger railways.
8.1.2 Subsectors Considered
The transport sector was disaggregated into the following subsectors:
- Road transport – Cars
- Road transport – Light goods vehicles (LGVs)
- Road transport – Heavy goods vehicles (HGVs)
- Road transport – Buses and coaches
- Road transport – Public transport fleet
- Road transport – Motorcycles
- Rail transport
- Aviation – Domestic
- Aviation – International
- Shipping – Domestic
- Shipping – International
Road transport has been divided into the main vehicle types to acknowledge their different contribution to overall GHG emissions and their different decarbonisation paces. In addition, we distinguished the public sector fleet, which includes all vehicle types, to model specific policies within this segment. For aviation and maritime transport, domestic and international transport emissions have been distinguished.
8.1.3 Data Sources
The main data sources used to undertake the assessment of the transport sector are detailed in Table 8‑1 below.
| Purpose | Data used | Comment |
|---|---|---|
| GHG inventory for Scotland | UK National Atmospheric Emissions Inventory (UK NAEI) | GHG inventory for Scotland needed to estimate impacts of policies on emissions. |
| Energy consumption in Scotland | UK National Atmospheric Emissions Inventory (UK NAEI) | Energy consumption by sub-sector in Scotland needed to estimate impacts of policies on energy use. |
| Travel behaviour | Scottish Household Survey 2019 | Mode share, average distance by mode |
| Road transport traffic | Scottish Transport Statistics 2021 (Chapter 5) | Traffic (in million veh-km) by sub-sector and by road type |
| Road transport traffic forecast | Transport Model for Scotland (TMfS) - Transport Forecast Derivation | Expected traffic growth by 2045 without further policy action |
| Road vehicle characteristics | Scottish Transport Statistics 2021 (Chapter 1 and 13) | Licenced fleet, new vehicle registrations, ultra-low emission vehicles (ULEV) licenced, ULEV new registrations, average emission factor (in gCO2/km) |
| Public sector fleet characteristics | Transport Scotland Decarbonisation Fleet Research Report 2020 | Number of vehicles by type and share of GHG emissions by vehicle type |
| Rail traffic and network characteristics | Scottish Transport Statistics 2021 (Chapter 7) | Passenger activity (in million pax-km) and freight activity (in thousand net tonne-km) |
| Rail passenger traffic projections | Transport Scotland - Transport Forecasts 2018 | Forecasted demand growth by 2030 and 2045 |
| Rail freight traffic projections | Network Rail - Rail freight forecasts: Scenarios for 2033/34 & 2043/44 | Forecasted demand growth |
| Air transport traffic | Scottish Transport Statistics 2021 (Chapter 8) | Aircraft movements for domestic and international aviation |
| Air transport traffic projections | UK Jet zero strategy (Scenario 1- Continuation of current trends) | Expected growth in air transport movements by 2050 |
| Shipping activity | Scottish Transport Statistics 2021 (Chapter 8) | Domestic and international freight traffic at major ports (in thousand tonnes) |
| Shipping activity projections | UK Port Freight Traffic 2019 Forecasts | Forecasted growth in freight traffic |
| Ferries fleet characterisation | CalMac - Environmental Strategy 2021-2023 Audit Scotland - Transport Scotland's ferry services | Number of ferries, total energy consumption and CO2 emissions |
8.1.4 Underlying Drivers of Energy & Emissions
Table 8‑3 presents the underlying drivers for each sub-sector, which constitute the baseline scenario to be compared against policy scenarios in the following sections.
| Sub-sector | Drivers | Main assumptions |
|---|---|---|
| Cars | Traffic (in veh-km) | Projections as per high scenario of latest TMfS traffic projections. This represents the "without policy" scenario. |
| Energy efficiency | Fleet-wide energy consumption decreasing by 2% annually as per current and future EU emission standards and considering fleet replacement ratio. | |
| Uptake of ULEV | Growth rate for ULEV assuming 2018/2019 growth rate remains constant. Average annual mileage per car assumed at 15.000 km. Average energy consumption for ICE cars assumed at 8 MWh. EV energy consumption assumed at 200 Wh/km. | |
| LGVs | Traffic (in veh-km) | Projections as per high scenario of latest TMfS traffic projections. This represents the "without policy" scenario. |
| Energy efficiency | Fleet-wide energy consumption decreasing by 2.5% annually as per current and future EU emission standards and considering fleet replacement ratio. | |
| Uptake of ULEV | Growth rate for ULEV assuming 2018/2019 growth rate remains constant. Average annual mileage per LGV assumed at 26.000 km. Average energy consumption for ICE cars assumed at 20 MWh. EV energy consumption assumed at 230 Wh/km. |
| Sub-sector | Drivers | Main assumptions |
|---|---|---|
| HGVs | Traffic (in veh-km) | Projections as per high scenario of latest TMfS traffic projections. This represents the "without policy" scenario. |
| Energy efficiency | Fleet-wide energy consumption decreasing by 1.2% annually as per current and future EU emission standards and considering fleet replacement ratio. | |
| Uptake of ULEV | Growth rate for ULEV assuming 2018/2019 growth rate remains constant. Average energy consumption for ICE HGV assumed at 167 MWh. Energy consumption for ULEV assumed to be half of that of ICE. | |
| Buses | Demand (in passenger journeys) | Slight decrease in passengers as per Transport Scotland Projections 2018 |
| Uptake of ULEV | Growth rate for ULEV assuming 2018/2019 growth rate remains constant. Average energy consumption for ICE bus assumed at 129 MWh. Energy consumption for ULEV assumed to be half of that of ICE. | |
| Motorcycles | Traffic (in veh-km) | Projections as per high scenario of latest TMfS traffic projections. This represents the "without policy" scenario. |
| Uptake of ULEV | Growth rate for ULEV assuming 2018/2019 growth rate remains constant. | |
| Aviation (domestic and international) | Aircraft movements | 1.3% ATM growth as per baseline scenario (current trends) of the UK jet zero strategy 2022 |
| Energy efficiency | 1.5% energy efficiency improvement as per assumptions of the UK jet zero emission strategy (current trends scenario) | |
| Shipping (domestic and international) | Freight demand (in tonnes) | 2.8% growth as per UK Port Freight Traffic 2019 Forecasts |
8.2 Policy Measures and Outcomes Modelled
8.2.1 Phase 1 – Policy Measures
For the transport sector there were a total of 49 policies which were reviewed and grouped into 8 themes, to allow policies with similar objectives to be assessed together and thus ensure interactions between similar policies/proposals were captured. All 49 policies are captured in the packages, but with many included in a supporting role, rather than a quantifiable role.
Policies under the first theme are related to transport demand management and aim to reduce car use by reducing the need to travel (or reducing travel distances), promoting a shift to more sustainable transport modes and promoting shared journeys. These policies are part of the route map to achieve a 20 per cent reduction in car kilometres by 2030.[47]
Policies under the following themes aim to promote the update of ultra-low emission vehicles (ULEVs) for road vehicles, with different paces, reflecting variations in technology maturity.
Policies to decarbonise the aviation and maritime sector with a focus on domestic operations were also screened. For aviation the focus is on flights in the HIAL region while maritime decarbonisation efforts will focus on ferry services. Low carbon traction options are more limited for these sectors (at least in the short term), which means that they may significantly rely on the use of sustainable drop-in fuels (sustainable aviation fuels (SAF) in the case of aviation).
The roadmap to decarbonise passenger rail services is well developed in the Rail Services Decarbonisation Action Plan in line with the UK-wide Traction Decarbonisation Network Strategy developed by National Rail.
| Theme | Quantifiable targets | Relevant policies / strategies / actions |
|---|---|---|
| Travel demand management | Overall target: Reduce car-km by 20% by 2030.
|
|
| Ultra-low emission cars and vans | Overall target: Phase out new petrol and diesel cars and vans by 2030. |
|
| Ultra-low emission vehicles in public fleets | Overall target: Phase out new petrol and vehicles by 2030. Related targets:
|
|
| Ultra-low emission heavy duty vehicles | Overall target: Phase out new petrol and diesel heavy duty vehicles by 2035. |
|
| Ultra-low emission buses | Overall target: Majority of new buses are zero-emission by 2024 |
|
| Low emission aircrafts and Sustainable Aviation Fuel (SAF) | Overall target: Decarbonise intra-Scotland flights by 2040. Related targets:
|
|
| Low emission ferries | Overall target: 30% of low emission ferries by 2032 |
|
| Rail network decarbonisation | Overall target: Decarbonise passenger rail services by 2035 Related targets:
|
|
The result of this grouping was the packaging of the 49 policies into 12 packages. These 12 packages, mapped against the policy outcomes for the transport sector, are presented below.
| Outcome | Policy packages |
|---|---|
| Outcome 1: To address our overreliance on cars, we will reduce car kilometres by 20% by 2030 | Package T1: Reducing the need to travel and living well locally Package T2: Switching mode - Promote active travel Package T3: Switching mode - Promote public transport Package T4: Combining trips or sharing journey |
| Outcome 2: We will phase out the need for new petrol and diesel cars and vans by 2030 | Package T5: Promotion of ULEV (cars and vans) Package T6: Promotion of ULEV (cars and vans) in public sector fleets |
| Outcome 3: To reduce emissions in the freight sector, we will work with the industry to understand the most efficient methods and remove the need for new petrol and diesel heavy vehicles by 2035. | Package T7: Promotion of low emission heavy duty vehicles |
| Outcome 4: We will work with the newly formed Bus Decarbonisation Taskforce, comprised of leaders from the bus, energy and finance sectors, to ensure that the majority of new buses purchased from 2024 are zero-emission, and to bring this date forward if possible. | Package T8: Promotion of ultra-low or zero emission buses |
| Outcome 5: We will work to decarbonise scheduled flights within Scotland by 2040. | Package T9: Promotion of low or zero emission aircrafts and SAF |
| Outcome 6: Proportion of ferries in Scottish Government ownership which are low emission has increased to 30% by 2032. | Package T10: Promotion of low or zero emission ferries |
| Outcome 7: By 2032 low emission solutions have been widely adopted at Scottish ports. | Package T11: Promotion of alternative fuel infrastructure in ports |
| Outcome 8: Scotland's passenger rail services will be decarbonised by 2035. | Package T12: Passenger rail decarbonisation |
Travel demand management
Transport Scotland forecasts show that traffic numbers are expected to increase during 2022 as COVID-19 restrictions further relax across the country and a return to work and other previously restricted activities occur. Nonetheless, it is expected, and building on the momentum shown during the pandemic, that digital connectivity will continue to enable people to work and connect with others remotely. Given a working from home element is, however, likely to remain in place during 2022, traffic levels are expected to increase to around 95% of those seen pre-pandemic. Traffic is then expected to further increase over the next 2-3 years as the country and economy recover but before interventions to deliver reductions in car traffic really start to make an impact.
Traffic levels are therefore expected to reach those recorded pre-pandemic during the short-term period. Notwithstanding this, the travel demand management measures put in place should show the capability, opportunity and motivation to choose an alternative to the car and support the foundation for achieving the longer-term goal to reduce car kilometres by 20%, by 2030.
Our assessment concluded, however, that policies promoting a mode shift (triggered by investments in active mobility and bus infrastructure/services) could only deliver a small fraction of the targeted car use reduction. The bulk of the reduction will have to be achieved with travel demand measures effectively reducing the need for travel (e.g. increase in homeworking).
It should be noted that travel behaviour is extremely complex, which makes it very difficult to isolate specific factors triggering a behavioural change. Because of this, effects of the travel demand policies were assessed in an aggregate manner based on scenarios agreed with the Scottish Government technical leads. The following scenarios were considered:
| Scenario | Outcome | Rationale |
|---|---|---|
| Existing travel demand policies | Existing measures are effective in achieving some car use reduction. This has been estimated at 10% reduction in car-km by 2030 in the central scenario. The low and high growth scenarios consider reductions of 5% and 15%, respectively. | Scenario with strong focus on promoting alternative modes and initial measures to reduce travel demand. There is a weak causal relationship between specific policy actions in the area of active travel and public transport and reduced car use, which limits the potential for these policies to effectively deliver car traffic reductions. This is because cross-elasticity of demand from car users to active travel and public transport is low. There is evidence that any increase in active mobility tends to be mostly replacing public transport journeys. It is also important to note that active mobility has a very limited potential to reduce car-km, since only the shortest journeys could be replaced. In addition, reduced car use leading to less congestion could actually have a rebound effect by increasing the capacity of the road network for latent car demand. The effect of economic growth in driving traffic activity is captured by considering lower reduction in traffic with high economic growth, while a low growth scenario would drive a higher reduction in traffic. |
| Full ambition scenario | Scenario with full policy ambition achieves the 20% car-km reduction target by 2030 by effectively reducing the overall demand for travel | Scenario with full ambition policies in the area of travel demand management, including promotion of homeworking and 20-minute neighbourhood concepts. Reduction in traffic levels is only expected to occur post-2025. With further enhancements to digital connectivity, the need to travel is expected to be reduced through flexible and local working. In addition, broader measures coming forward to support the need to travel less, rather than just reduce the need to travel to work, and with additional demand management measures will see a decline in trips towards the 20% target increasingly taking hold as we approach the 2030 deadline. |
Uptake of ULEV for road vehicles
For policies promoting an uptake of ULEV for road transport, we considered that phase-out targets and UK- In line with the Scottish Transport Statistics, ULEVs are defined as vehicles that are reported to emit less than 75g of CO2 from the tailpipe for every kilometre travelled. In practice, the term typically refers to battery electric, plug-in hybrid electric and fuel cell electric vehicles.
wide bans for new diesel and petrol vehicles will effectively induce a transition to ULEV, with a progressive increase in ULEV sales from 2019 to the phase-out year. This uptake in ULEV will also be supported by policies in place to offer financial and technical support to ULEV users.
In general, we assumed that both the fleet size and the current fleet replacement rate per sub-sector would remain constant throughout the evaluated period.
The main assumption regarding ULEV uptake for the different sub-sectors are described below in Table 8‑9. The uptake assumptions largely follow the forecasts elaborated by the Scottish Government.
| Sub-sector | ULEV sales in 2025 (%) | ULEV sales in 2030 (%) | ULEV by 2040 (% of the fleet) |
|---|---|---|---|
| Cars | 26 | 100 | 100 |
| LGV | 19 | 100 | 100 |
| HGV | 0 | 33 | 85 |
| Buses | 100 | 100 | 100 |
| Motorcycle | 26 | 100 | 100 |
| Public sector vehicles | 50 | 100 | 100 |
The low growth and high growth scenarios are assumed to decrease and increase, respectively, the number of ULEV in the market. The main driver in this case would be the effect that economic growth may have on the number of vehicles being sold each year.
In the model we have assumed two different phases for the uptake of ULEVs: one from 2020-2030 and another from 2030-2040. This captures the fact that the uptake is expected to be higher from 2030, particularly for vehicle types that are more difficult to decarbonise (e.g. HGVs). Phase 2 modelling acknowledges that the uptake of ULEVs is likely to be less linear than this, by introducing additional 5-year time step between 2020-2025 and 2025-2030. This means that in some years the Phase 1 modelling results estimate a greater emissions reduction potential from policies to promote ULEV uptake than under Phase 2 modelling with full policy ambition.
Decarbonisation of aviation, shipping and railways
Low carbon fuel technologies for aviation and shipping are still at the early stages, which means that the policy landscape is also less well developed. For aviation, we have considered the UK jet zero strategy as the main driver for GHG emission reductions in domestic air transport operations. For shipping, our assessment focused on the targeted decarbonisation of the Scottish ferry fleet.
In rail transport, electrification is expected to be the main driver of decarbonisation. We assumed that the network will be fully electrified (or hydrogen and battery supply infrastructure will be in place) by 2035 in line with the current commitments in Rail Services Decarbonisation Action Plan.
Our assessment build on the following assumptions:
| Sub-sector | Indicators | Assumptions |
|---|---|---|
| Aviation | SAF share (%) | 10% SAF share by 2030 |
| Shipping | Low emission ferries | 30% of ferries (13 in total) will be low emission. Average energy consumption per ferry per year estimated at 14 MWh, as per emissions reported by CalMac in environmental report and total fleet. Energy savings from hybrid ferries estimated at 20% as reported by Rehmatulla (2020) |
| Railways | Km of network electrification | 100% of km electrified (or available for battery or hydrogen traction) by 2035 |
8.2.2 Phase 2 – Outcomes
A workshop was held to discuss options for modelling additional targets as part of Phase 2 of the Provision of Emissions Projections project. Agreements on modelling assumptions for each policy outcome are summarised in the table below. The workshop was also used to validate modelling assumptions for policy measures in Phase 1.
Following up on the workshop, Transport Scotland shared further data for Phase 2 modelling, notably emissions from air transport within Scotland and recent work on HGV decarbonisation strategy.
As a result of the workshop, the following modelling assumptions per policy outcome were included in the additional modelling under Phase 2.
| Policy outcome | Quantifiable targets | Modelling assumptions |
|---|---|---|
| Outcome 1: To address our overreliance on cars, we will reduce car kilometres by 20% by 2030 | 20% reduction in car kms from the 2019 baseline by 2030 | 20% reduction in car-km by 2030 on 2019 levels in the central scenario. This differs from modelling assumption under Phase 1, which considered partial achievement of the policy outcome with a 10% reduction in car-km by 2030 in the central scenario. |
| Outcome 2: We will phase out the need for new petrol and diesel cars and vans by 2030 | 100% new car registrations are ULEV by 2030 100% new van registrations are ULEV by 2030 | Targeted values do not differ from those of the Phase 1. However, an additional time step was added to the model. The model now considers the following steps: 2020-2025, 2025-2030, 2030-2040 |
| Outcome 3: To reduce emissions in the freight sector, we will work with the industry to understand the most efficient methods and remove the need for new petrol and diesel heavy vehicles by 2035. | 100% of new HGV registrations are ULEV in 2035 | Targeted values do not differ from those of the Phase 1. However, an additional time step was added to the model. The model now considers the following steps: 2020-2025, 2025-2030, 2030-2040 |
| Outcome 4: We will work with the newly formed Bus Decarbonisation Taskforce, comprised of leaders from the bus, energy and finance sectors, to ensure that the majority of new buses purchased from 2024 are zero-emission, and to bring this date forward if possible. | More than half of new buses are ULEV by 2024 | Targeted values and modelling assumptions do not differ from those of the Phase 1. |
| Policy outcome | Quantifiable targets | Modelling assumptions |
|---|---|---|
| Outcome 5: We will work to decarbonise scheduled flights within Scotland by 2040. | Net emissions from domestic flights in Scotland are zero by 2040 | Besides assumption on SAF uptake by 2030 (included in Phase I), the model also assumes full decarbonisation of domestic flights within Scotland by 2040, which represent 7% of emissions from domestic aviation (i.e. to/from UK destinations) |
| Outcome 6: Proportion of ferries in Scottish Government ownership which are low emission has increased to 30% by 2032. | 30% of Ferries in Scottish Government ownership are low emission by 2032. | Targeted values and modelling assumptions do not differ from those of the Phase 1 |
| Outcome 7: By 2032 low emission solutions have been widely adopted at Scottish ports. | By 2032 low emissions solutions have been widely adopted at Scottish ports | Outcome is not likely to lead to GHG emission reduction by itself. Targeted values and modelling assumptions do not differ from those of the Phase 1 |
| Outcome 8: Scotland's passenger rail services will be decarbonised by 2035. | Scotland's passenger rail services will be decarbonised by 2035 | Targeted values and modelling assumptions do not differ from those of the Phase 1 |
8.2.3 Summary of Policy Packages
The table below indicates which policies were found to have the biggest potential impact within each package, which policies overlap with (or reinforce) each other, and which policies act as supporting measures.[48]
Within the Transport sector, many policies interact with each other, as there may be multiple initiatives (including infrastructure investment) aimed at achieving the same goal. In broad terms, the policies that are likely to deliver the biggest reductions in emissions in this sector will be those that either reduce demand for private transport, or promote a phase-out of fossil fuel road vehicles, ferries and aircraft.
| Policy Package | Policy | Categorisation |
|---|---|---|
| T1 Reducing the need to travel and living well locally |
Policy 1: If the health pandemic has moved to a phase to allow more certainty on future transport trends and people's behaviours – and work and lifestyle choices future forecasting – we will publish a route-map to meet the 20% reduction by 2030 in 2021. | Supporting measure |
| Policy 2: Commit to exploring options around remote working, in connection with our work on 20-minute neighbourhoods and work local programme. | Overlapping/reinforcing measure | |
| Policy 3: COVID-19 has impacted on how we work. We launched a Work Local Challenge to drive innovation in work place choices and remote working to support flexible working and our net zero objectives. | Overlapping/reinforcing measure | |
| Policy 4: We will work with the UK Government on options to review fuel duty proposals, in the context of the need to reduce demand for unsustainable travel and the potential for revenue generation. | Overlapping/reinforcing measure | |
| Policy 5: We will work with local authorities to continue to ensure that their parking and local transport strategies have proper appreciation of climate change, as well as the impact on all road users, including public transport operators, disabled motorists, cyclists and pedestrians. | Overlapping/reinforcing measure | |
| Policy 6: To support the monitoring requirement for the National Transport Strategy set out in the Transport (Scotland) Act 2019, and to further our understanding of how and why people travel, we will develop a data strategy and invest in data. | Supporting measure |
| Policy Package | Policy | Categorisation |
|---|---|---|
| T2 Switching mode - Promote active travel |
Policy 7: Continue to support the Smarter Choices, Smarter Places (SCSP) programme to encourage behaviour change. Continue to support the provision of child and adult cycle training, and safety programmes including driver cycling awareness training through Bikeability. | Supporting measure |
| Policy 8: Support transformational active travel projects with a £500 million investment, over five years, for active travel infrastructure, access to bikes and behaviour change schemes. Enabling the delivery of high quality, safe walking, wheeling and cycling infrastructure alongside behaviour change, education and advocacy to encourage more people to choose active and sustainable travel. Support the use of E-bikes and adapted bikes through interest free loans, grants and trials. | Key policy | |
| Policy 9: We have re-purposed almost £39 million of active travel funding for the Spaces for People; this is enabling local authorities to put in place the temporary measures such as pop-up cycle lanes and widening walkways that are needed to allow people to physically distance during transition out of the COVID-19 lockdown. | Overlapping/reinforcing measure | |
| Policy 10: Support increased access to bikes for all including the provision of public bike and e-bike share. | Overlapping/reinforcing measure |
| Policy Package | Policy | Categorisation |
|---|---|---|
| T3 Switching mode - Promote public transport |
Policy 14: We will bring forward a step change in investment with over £500 million to improve bus priority infrastructure to tackle the impacts of congestion on bus services and raise bus usage. We will launch the Bus Partnership Fund in the coming months to support local authorities' ambitions around tackling congestion. | Key policy |
| Policy 15: We remain committed to delivering a national concessionary travel scheme for free bus travel for under 19s, and have begun the necessary preparations including planning, research, legal review and due diligence. | Overlapping/reinforcing measure | |
| Policy 16: We are also carrying out a review of discounts available on public transport to those under the age of 26 – due for completion end of December 2020 (with consultation planned on young people's views on the impacts of COVID 19 and post lockdown measures on public transport usage and behaviour). | Overlapping/reinforcing measure |
| Policy Package | Policy | Categorisation |
|---|---|---|
| T4 Combining trips or sharing journey |
Policy 11: Mobility as a Service and increased use of peer to peer car sharing which will help reduce the number journeys made by car. To do this we are harnessing innovation within our transport system through investing up to £2 million over three years to develop 'Mobility as a Service' (MaaS) in Scotland. We will grant funding CoMoUK to increase awareness of the role and benefits of shared transport and looking at the barriers to uptake of car clubs. We will provide support for travel planning through Travelknowhow Scotland, which is an online resource which offers employers access to sustainable travel planning tools to develop and implement workplace Travel Plans and encourage ride-sharing in order to start changing travel behaviour within organisations. | Overlapping/reinforcing measure |
| Policy 12: We will work to improve road safety, ensuring people feel safe with appropriate measures in place to enable that. We will publish Scotland's Road Safety Framework to 2030, following consultation on an ambitious and compelling long-term vision for road safety where there are zero fatalities or serious injuries on Scotland's roads by 2050. | Overlapping/reinforcing measure | |
| Policy 13: We are committed to taking forward policy consultation in advance of drafting supporting regulations and guidance to enable local authorities to implement workplace parking levy schemes that suit their local circumstances. | Overlapping/reinforcing measure |
| Policy Package | Policy | Categorisation |
|---|---|---|
| T5 Promotion of ULEV (cars and vans) |
Policy 1: We will consider and develop new financing and delivery models for electric vehicle charging infrastructure in Scotland and working with the Scottish Future Trust to do so. | Overlapping/reinforcing measure |
| Policy 2: We have invested over £30m to grow and develop the ChargePlace Scotland network which is now the 4th largest in the UK. We will continue to develop the capacity of the electric vehicle charging network. | Overlapping/reinforcing measure | |
| Policy 3: Our Low Carbon Transport Loan has provided over £80m of funding to date to support the switch to low carbon vehicles. We will continue to support the demand for ultra-low emission vehicles (ULEVs) through our Low Carbon Transport Loan scheme, which is now being expanded to include used electric vehicles. | Key policy | |
| Policy 5: Continue to promote the benefits of EVs to individuals and fleet operators (exact nature of promotion to be decided annually). | Overlapping/reinforcing measure | |
| Policy 6: We will work with public bodies to phase out the need for any new petrol and diesel light commercial vehicles by 2025. | Key policy | |
| Policy 9: We will continue to invest in innovation to support the development of ULEV technologies and their adoption. | Supporting measure | |
| Policy 10: Take forward the initiatives in respect of connected and autonomous vehicles set out in A CAV Roadmap for Scotland. | Overlapping/reinforcing measure | |
| Policy 11: With local authorities and others, evaluate the scope for incentivising more rapid uptake of electric and ultra-low emission cars and vans. | Overlapping/reinforcing measure |
| Policy Package | Policy | Categorisation |
|---|---|---|
| T6 Promotion of ULEV (cars and vans) in public sector fleets |
Policy 4: We will continue to promote the uptake of ULEVs in the taxi and private hire sector. | Overlapping/reinforcing measure |
| Policy 7: We will support the public sector to lead the way in transitioning to EVs, putting in place procurement practices that encourage EVs. In the Programme for Government we committed to work with public bodies to phase out the need for any new petrol and diesel light commercial vehicles by 2025. | Key policy | |
| Policy 8: Create the conditions to phase out the need for all new petrol and diesel vehicles in Scotland's public sector fleet by 2030. | Key policy |
| Policy Package | Policy | Categorisation |
|---|---|---|
| T7 Promotion of low emission heavy duty vehicles |
Policy 1: To support businesses we will establish a Zero Emission heavy duty vehicle programme and will invest in a new zero drive train testing facility in 2021. | Key policy |
| Policy 2: Explore the development of green finance models to help business and industry to invest in new road transport technologies. | Supporting measure | |
| Policy 3: We will engage with industry to understand how changing technologies and innovations in logistics (including consolidation centres) can help to reduce carbon emissions, particularly in response to the increase in e-commerce. | Supporting measure | |
| Policy 4: Continue to investigate the role that other alternative fuels, such as hydrogen, and biofuel can play in the transition to a decarbonised road transport sector. Consider the scope for testing approaches to alternative fuels infrastructure and supply. | Supporting measure | |
| Policy 5: Launched the new Hydrogen Accelerator Programme to attract technical experts to help scale up and quicken the deployment of hydrogen technologies across Scotland. | Supporting measure | |
| T8 Promotion of ultra-low or zero emission buses |
Policy 1: We have introduced a revised green incentive of the Bus Service Operators Grant. | Key policy |
| Policy 2: We launched a £9 million Scottish Ultra Low Emission Bus Scheme (SULEBS). | Overlapping/reinforcing measure | |
| Policy 3: In the context of the National Transport Strategy Delivery Plan and Transport Act, we will examine the scope for climate change policies, in relation to buses, across the public sector in high-level transport legislation strategies and policies. | Supporting measure | |
| Policy 4: We will work to align government financial support of £120 million over the next 5 years with private sector investment to decarbonise the bus sector. | Key policy |
| Policy Package | Policy | Categorisation |
|---|---|---|
| T9 Promotion of low or zero emission aircrafts and SAF |
Policy 1: We will aim to create the world's first zero emission aviation region in partnership with Highlands and Islands Airports Limited (HIAL). This will include taking action to decarbonise airport operations in the HIAL region. | Key policy |
| Policy 2: We will begin trialling low or zero emission planes in 2021. | Supporting measure | |
| Policy 3: The Scottish Government will continue to engage with Aviation sector to encourage sustainable growth post COVID-19. | Overlapping/reinforcing measure | |
| Policy 4: Explore the potential for the purchase of zero/low emission aircraft by the Scottish Government, for lease back to operators, with more detailed assessment in the forthcoming Aviation Strategy. | Supporting measure | |
| Policy 5: Explore options for incentivising the use of more sustainable aviation fuel as we develop our Aviation Strategy, recognising that significant levers in this area are reserved. | Overlapping/reinforcing measure | |
| T10 Promotion of low or zero emission ferries |
Policy 1: Continue to examine the scope for utilising hybrid and low carbon energy sources in the public sector marine fleet as part of our vessel replacement programme. | Key policy |
| Policy 2: Working with the UK Government to support proposals at the International Maritime Organisation (IMO) to significantly lower shipping carbon emissions in the global sector, including the option of introducing a global levy on marine fuel to fund research in cleaner technologies and fuels | Supporting measure |
| Policy Package | Policy | Categorisation |
|---|---|---|
| T11 Promotion of alternative fuel infrastructure in ports |
Policy 1: Working with individual ports and the British Ports Association to consider a process for encouraging shared best practice initiatives for reducing emissions across the sector. | Overlapping/reinforcing measure |
| Policy 2: Working with the ports sector and with its statutory consultees through the Harbour Order process to ensure future port developments are environmentally underpinned. | Supporting measure | |
| T12 Passenger rail decarbonisation |
Policy 1: Our commitment to decarbonise (the traction element of) Scotland's railways by 2035 will be delivered through investment in electrification and complementary alternative traction systems. Transport Scotland has published the Rail Services Decarbonisation Action Plan (July 2020) which will be updated as appropriate. Work is ongoing by industry partners to develop the initial schemes. | Key policy |
| Policy 2: We will establish an international rail cluster in Scotland to unlock supply chain opportunities using the interest at Longannet as a catalyst. This will be built around existing strengths in rail in Scotland and will seek to enhance the innovation and supply chain in the decarbonisation of our rolling stock and wider network. | Supporting measure | |
| Policy 3: Continue to deliver our Rail Freight Strategy. | Overlapping/reinforcing measure |
8.2.4 Variation across scenarios
Higher economic growth is assumed to increase traffic, as evidence suggests that there is a correlation between passenger transport and GDP growth.[49] So, while all scenarios assume that there is some level of reduction in travel demand, in the high growth scenario the GHG reduction from Policy T2: travel demand management is smaller.
On the other hand, higher economic growth is assumed to result in greater affordability of EVs; it also increases the amount of public funding available to support the transition. So, in the high growth scenario, we have assumed that ULEV uptake, network electrification, use of SAF and low emission ferries will all increase.
8.3 Emissions Projections
8.3.1 Phase 1 results
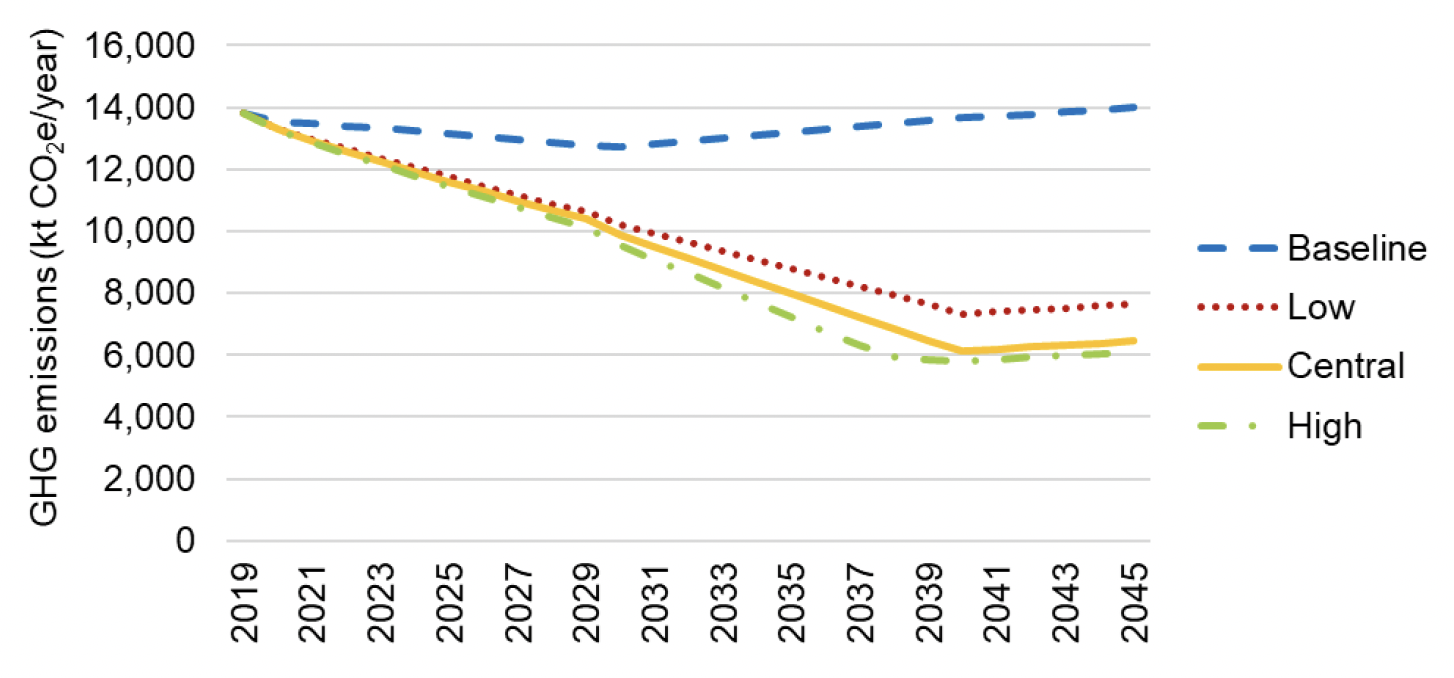
Total CO2 emissions from the transport sector are expected to drop from around 13.8 MtCO2 in 2019 to around 6.4 MtCO2 by 2040. The remaining emissions by 2040 would be mostly coming from aviation and shipping. The existing policy measures to decarbonise domestic aviation and shipping would only deliver a limited reduction in CO2 emissions.
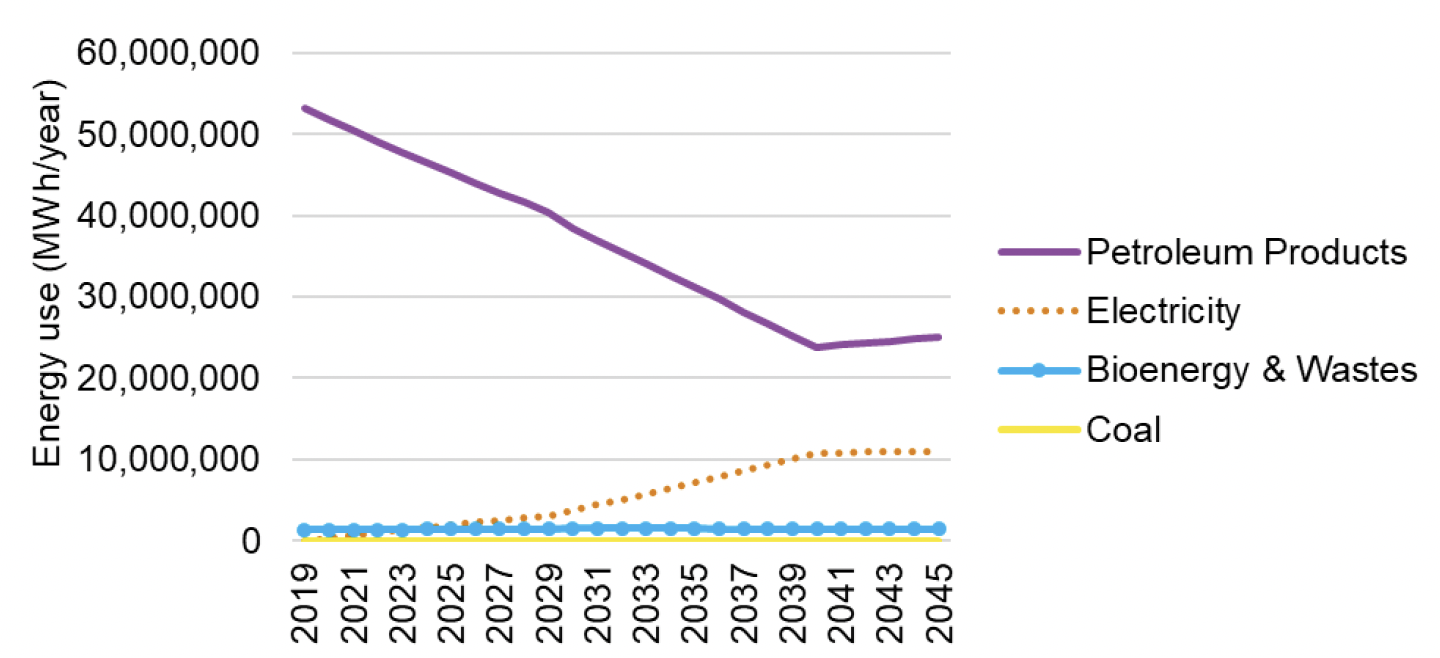
The transport sector is expected to reduce its reliance on petroleum products as it transitions to low and zero carbon technologies. The expected electrification of road transport by 2040 would increase the electricity consumption of this sector. Since electric powertrains tend to be more energy efficient than internal combustion engines, the overall energy consumption is expected to drop substantially.
8.3.2 Phase 2 results
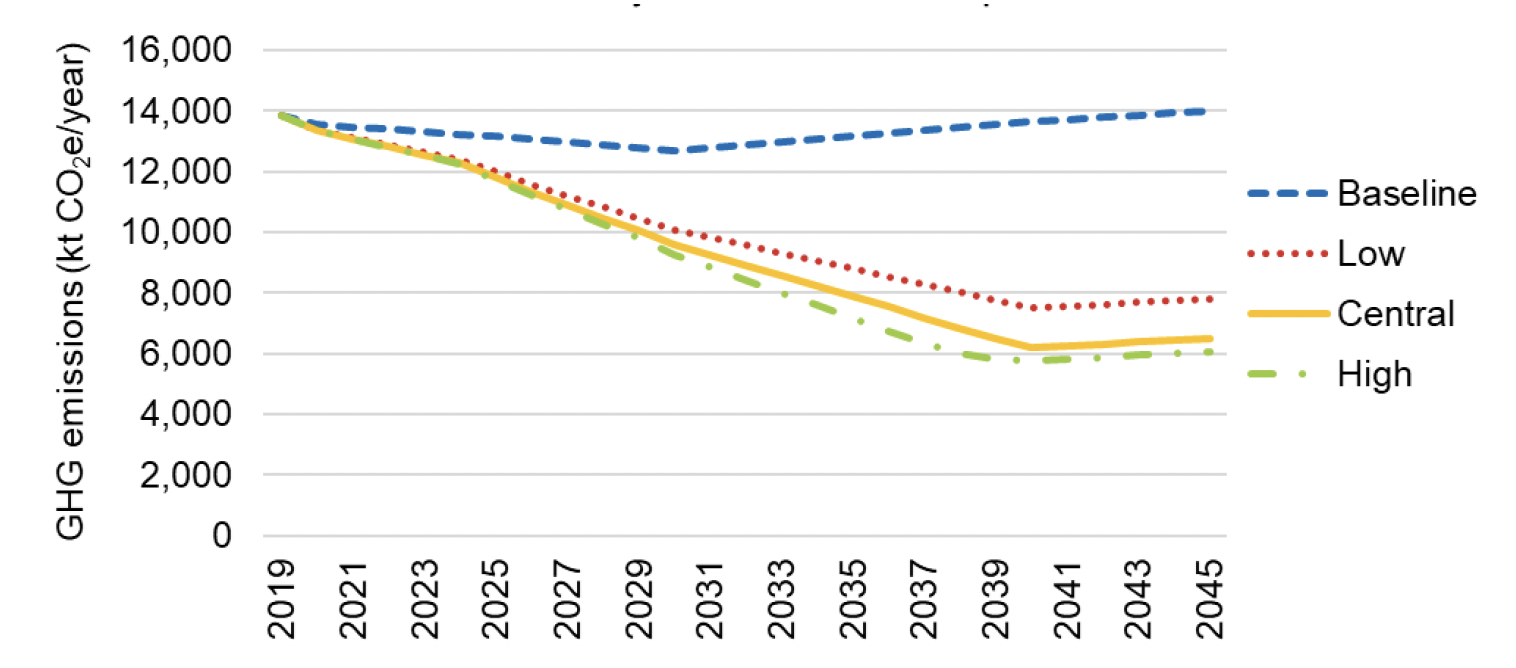
It is important to note that the main difference with the Phase 1 modelling assumptions is the increased car traffic reduction by 2030 (outcome 1), which captures a full achievement of the traffic reduction target. The full decarbonisation of internal flights within Scotland (outcome 5), which was not included in Phase 1, represents a small proportion of overall emissions from aviation and, hence, it is not expected to alter emission projections significantly.
The resulting emission projection by 2050 under Phase 2 modelling assumptions is displayed below. Total CO2 emissions from the transport sector are expected to drop from around 13.8 MtCO2 in 2019 to around 6.2 MtCO2 by 2040. This projection is very similar to that of Phase 1.
8.3.3 Comparison of Phases 1 & 2
The table below provides a comparison of the projected emissions for Phase 1 and Phase 2 (in ktCO2e) and by scenario. Emissions in 2030 and 2035 are lower under Phase 2 modelling assumptions due to the effect of the higher car traffic reduction by 2030. Differences in 2020 and 2025 between Phase 1 and Phase 2 assumption are mostly due to the additional time granularity to describe the uptake of ULEV in Phase 2. Similarly, higher emissions in 2040 and 2045 under Phase 2 relate to the more refined time granularity in Phase 2 modelling.[50] This is a limitation of the Phase 1 modelling approach and should be considered when comparing projections from Phase 1 and Phase 2.
| Phase | Scenario | Emissions (ktCO2e) | ||||||
|---|---|---|---|---|---|---|---|---|
| 2019 | 2020 | 2025 | 2030 | 2035 | 2040 | 2045 | ||
| n/a | Baseline | 13,820 | 13,551 | 13,149 | 12,698 | 13,175 | 13,647 | 13,996 |
| 1 | Central Growth | 13,820 | 13,274 | 11,601 | 9,873 | 7,999 | 6,134 | 6,440 |
| High Growth | 13,820 | 13,246 | 11,446 | 9,543 | 7,240 | 5,803 | 6,097 | |
| Low Growth | 13,820 | 13,301 | 11,756 | 10,203 | 8,791 | 7,337 | 7,652 | |
| 2 | Central Growth | 13,820 | 13,349 | 11,805 | 9,585 | 7,880 | 6,197 | 6,505 |
| High Growth | 13,820 | 13,345 | 11,735 | 9,265 | 7,167 | 5,770 | 6,066 | |
| Low Growth | 13,820 | 13,374 | 11,985 | 10,074 | 8,799 | 7,494 | 7,810 | |
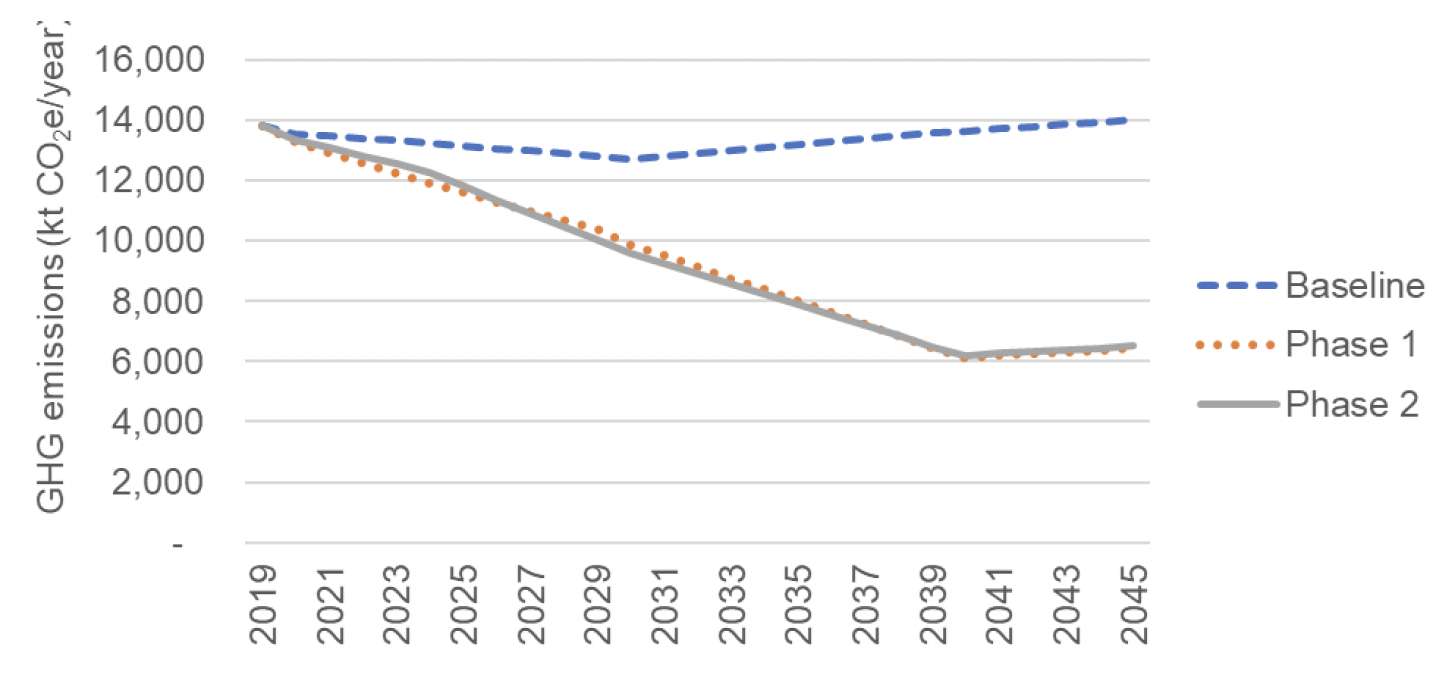
Note: The results from Phases 1 and 2 are visibly almost indistinguishable from each other because of the small magnitude of differences between them.
8.3.4 Emissions reduction by policy package (2032) – Phase 1 & 2
This section presents results on the contribution of each policy package (as described in Table 8‑7) to emission reductions of each policy outcome considered in the model.
Results presented in Table 8‑23 indicate that the promotion of ULEV for cars and vans (policy package T5) contribute the most to the overall emission reduction by 2032 across all scenarios (with 64% of total emission reduction). Travel demand policies (policy packages T1, T2, T3 and T4) and the promotion of ULEV for heavy duty vehicles (policy package T7) also represent a significant proportion of overall emissions reduction, with 9% and 12% of the total reduction, respectively. Other policy packages have more limited contributions to the overall reduction of GHG emissions in the transport sector by 2032.
The total reduction of GHG emissions by 2032 is slightly higher under Phase 2 assumptions, compared to Phase 1. As above mentioned, the main difference between Phase 1 and Phase 2 relates to the achievement of the 20% car traffic reduction target by 2030 (i.e. full achievement in Phase 2 and 10% reduction in Phase 1). This means that the difference of around 200 ktCO2e between the central scenario in Phase 2 and Phase 2 can be attributed to the effect of the more pronounced car traffic reduction in Phase 2.
| Policy Package | Emissions reductions by 2032 (ktCO2e) | |||||
|---|---|---|---|---|---|---|
| Phase 1 | Phase 2 | |||||
| Central Growth | High Growth | Low Growth | Central Growth | High Growth | Low Growth | |
| T1-4 | -339 | -170 | -509 | -678 | -509 | -678 |
| T5 | -2,403 | -2,883 | -1,922 | -2,210 | -2,652 | -1,768 |
| T6 | -113 | -136 | -91 | -113 | -136 | -91 |
| T7 | -445 | -534 | -356 | -502 | -603 | -402 |
| T8 | -271 | -325 | -217 | -271 | -325 | -217 |
| T9 | -39 | -47 | -32 | -39 | -47 | -32 |
| T10 | 0 | 0 | 0 | 0 | 0 | 0 |
| T12 | -143 | -172 | -115 | -143 | -172 | -115 |
| Total | -3,754 | -4,268 | -3,241 | -3,957 | -4,443 | -3,301 |
8.4 Uncertainties
Due to the number of assumptions used, we suggest that the energy use and GHG emission projections are indicative but are sufficient to allow an informed debate about the future trajectory of emissions in the sector, and, to identify policies which are likely to deliver meaningful GHG reductions. There is a high level of uncertainty associated with the technical and economic characteristics of fuel-switching technologies, particularly for aviation and shipping sectors. In addition, there is a large uncertainty around transport activity levels in the years following the Covid-19 pandemic.
Overall, the level of uncertainty was estimated at 15% for road and rail transport and 20% for aviation and shipping.
8.5 Sensitivities
In the model, the uptake of zero emission technologies for road transport is conditioned by phase-out targets for internal combustion engine vehicles. As such, projections for road transport will be mostly affected by changes in road transport demand in the following years. Phase 2 modelling assumes the 20% traffic reduction target by 2030 is fully achieved, while the modelling of policies assumes only a partial reduction by 2030. The difference between Phase 1 and Phase 2 can be used to assess the sensitivity around car traffic trends. For aviation and maritime, the uptake of sustainable drop-in fuels (e.g. SAF for aviation or ammonia for maritime transport) is expected to be the main sensitivity parameter.
Contact
Email: Edward.Mchardy@gov.scot
There is a problem
Thanks for your feedback