Greenhouse gas emissions projections: phase 1 and phase 2 modelling results
Analysis undertaken by Ricardo-AEA for the Scottish Government to provide an estimated projection of Scottish emissions from 2019 to 2045 which capture announced Scottish and UK policies.
Appendix 2. Historical GHG emissions
This section presents Scotland's historical GHG emissions from 1990-2020[66]. Note: The sectors as defined in the GHG inventory do not align to the sectors as used in the CCPu (e.g., there is no "buildings" sector). Sectoral reallocations were undertaken for the purpose of the emissions projections, but were not applied to historical data.
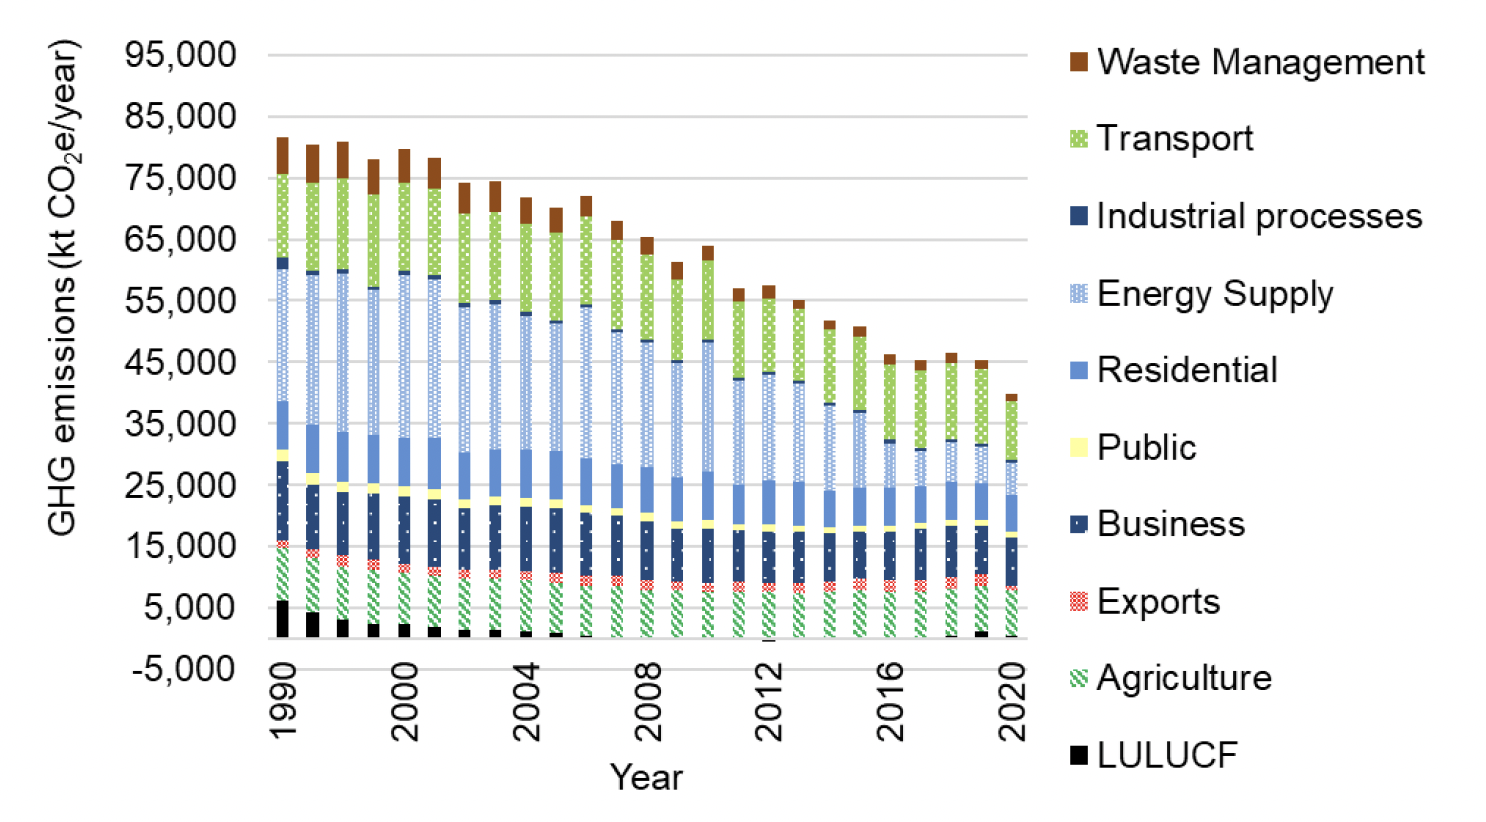
Total emissions for Scotland as a whole have decreased from 81,609 ktCO2e in 1990 to 39,952 ktCO2e in 2020. While 2020 was the latest inventory year available, 2019 is used as the base year in this work because 2020 is considered an anomalous year (due to the COVID-19 pandemic). In 2019, total emissions for Scotland as a whole were 45,401 ktCO2e. The chart below shows the trend in total emissions over time, with sectoral contributions shown.
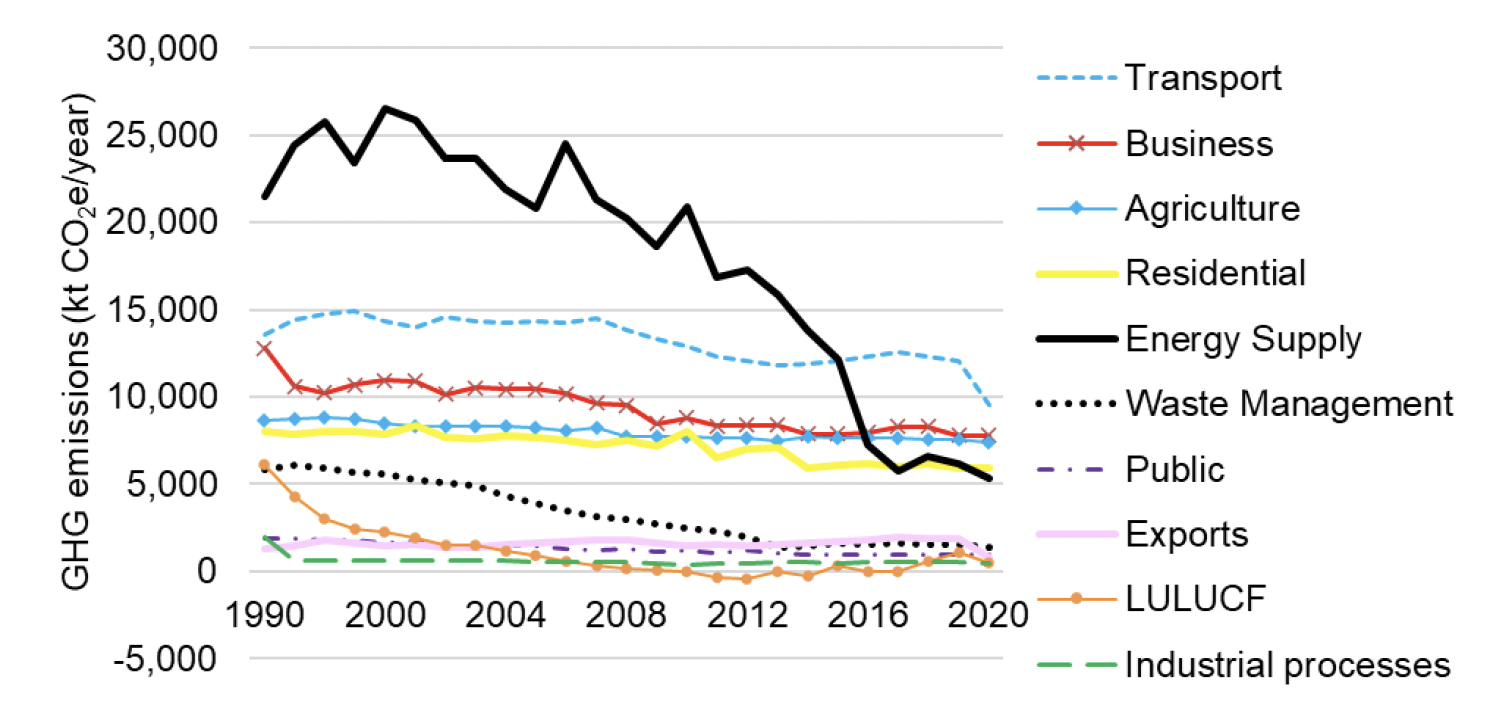
Trends over recent years for individual sectors vary, as shown in the chart below. The most important historical trend to note is the significant downward trend for 'Energy Supply' between 1990 and 2020. More gradual decreases have been seen in other sectors.
Contact
Email: Edward.Mchardy@gov.scot
There is a problem
Thanks for your feedback