Greenhouse gas emissions projections: phase 1 and phase 2 modelling results
Analysis undertaken by Ricardo-AEA for the Scottish Government to provide an estimated projection of Scottish emissions from 2019 to 2045 which capture announced Scottish and UK policies.
3. Methodology
3.1 Overview of approach
Our approach to delivering the GHG emissions projections is summarised in the diagram below.
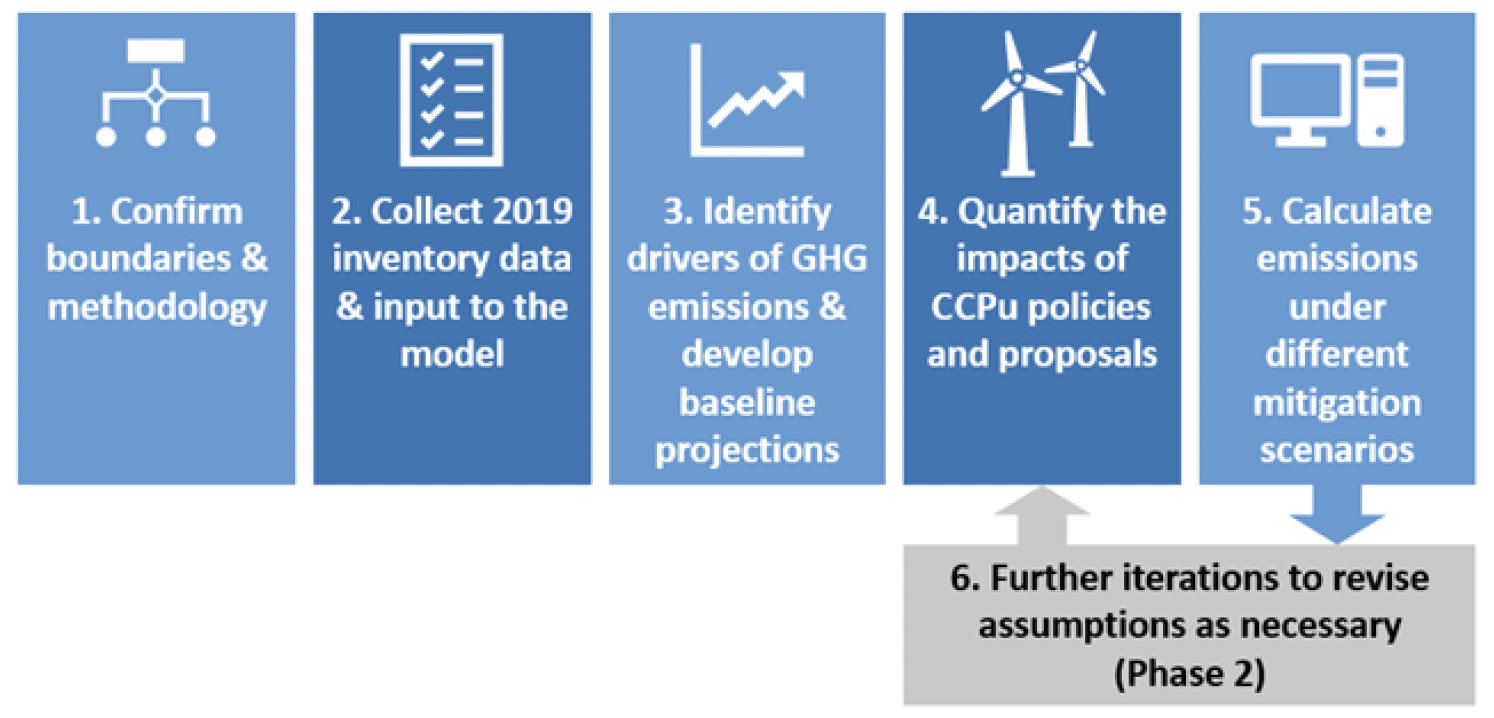
Step 1: The boundaries of the analysis and methodology were agreed at project inception. This included an initial screening exercise to establish which CCPu policies would be taken forward for assessment. Ricardo sector experts engaged with representatives of the Scottish Government to identify existing impact assessments for CCPu policies and, for those without an impact assessment, discuss how the GHG impacts could be quantified within the scope of this project.
Step 2: The next step was to collect inventory data and input this to the GHG projections model developed by Ricardo.
The GHG projections set out in this report use 2019 as the starting point or "base year". The source of this data was the Devolved Administration GHG inventory, which was published in 2022. The data in this publication is two years in arrears, so the most recent data it contained was for 2020. However, due to impacts of COVID-19 on the economy, the 2020 data was considered anomalous, and therefore the year 2019 was selected as the base year This approach meant that the starting year and baseline projection are consistent with historical trends in the inventory.
Step 3: From 2019 onwards, a baseline projection was then calculated. This is essentially a 'business as usual' scenario where trends continue without the influence of any mitigation policies. In the baseline scenario, the main drivers of change are associated with economic and population growth.
- Estimates of economic growth are based on projections for gross value added (GVA) as per Office of National Statistics (ONS) data on regional GVA.[5]
- Estimates of population growth are based on National Records of Scotland (NRS) population projections.[6]
In some sectors, energy use and emissions are assumed to scale directly with these trends. For instance, industrial emissions are assumed to scale with economic growth and domestic wastewater emissions are assumed to scale with population. In other sectors, the relationship is less direct, and/or there may be additional underlying drivers of energy use and emissions that were chosen for modelling in agreement with the Scottish Government. These are summarised in the table below. Further information on the sector-specific drivers is provided in subsequent chapters.
Table 3‑1. Underlying drivers of energy use and emissions in the Baseline scenario
| Sector | Underlying drivers of energy use and emissions in the Baseline scenario |
|---|---|
| Agriculture | Changes are based on straight line projections for livestock numbers and fertiliser use. |
| Buildings | Energy use in residential buildings is assumed to increase with new construction. The number of new dwellings is based on projected changes in population growth and number of households. Energy use in non-residential buildings is assumed to scale with economic growth (GVA). |
| Electricity | The main driver of emissions in this sector is the mix of technologies used for electricity generation in Scotland; the baseline scenario accounted for additional renewables that have been granted planning permission. |
| Industry | Emissions are assumed to scale with economic growth (GVA). |
| Transport | The baseline accounted for projected changes in:
|
| Waste | The baseline accounted for projected changes in the amount of waste generated and how it is treated (recycling, composting, landfill, and so on). Domestic wastewater emissions were assumed to scale with population growth. Industrial wastewater emissions were assumed to scale with economic growth. |
| Negative Emission Technologies (NETs) | N/a - In the baseline scenario, it was assumed that there would be no change in deployment of NETs. |
| Land use, land use change and forestry (LULUCF) | The main focus of emission projections in this sector were afforestation and peatland restoration. [Note, the work on this sector was completed by UK CEH using a sector-specific model. The methodological approach to the work was very different to that taken in the other sectors of the work. Details of the work are provided in Appendix 1.] |
The baseline, and all other future GHG pathways, were modelled using the Ricardo Net Zero Projections (NZP) tool, which enables users to model the impact of implementing mitigation measures on GHG emissions over time.
What is the NZP tool?
The tool is designed to enable the development of scenarios for reaching net zero by any given target year and allows the users to define mitigation measures for each line (sector, sub-sector, fuel type or source of emissions) in the GHG emissions inventory.
These scenarios can be used to build a baseline projection, assess the likely impact of planned measures, and model the impact of alternative strategies to reaching net zero ("scenarios"). The tool can also be used to undertake sensitivity testing around the impact of changes in assumptions.
GHG reductions from the mitigation measures in each sector and sub-sector were initially modelled separately, and then combined into a single model to ensure that interactions between sectors were accounted for.
Note the following:
- Modelling for the LULUCF sector was undertaken separately by CEH, and the results were integrated into the Ricardo NZP tool once they were finalised.
- We modelled electricity demand in each sector/sub-sector and then confirmed that the amount of electricity generated in Scotland would always exceed this demand, so there was no need to model imports of electricity.
Emissions in the baseline scenario are shown in the figure below. Overall, it is expected that there would be a relatively small (c. 5%) increase in total emissions between 2019 and 2045.
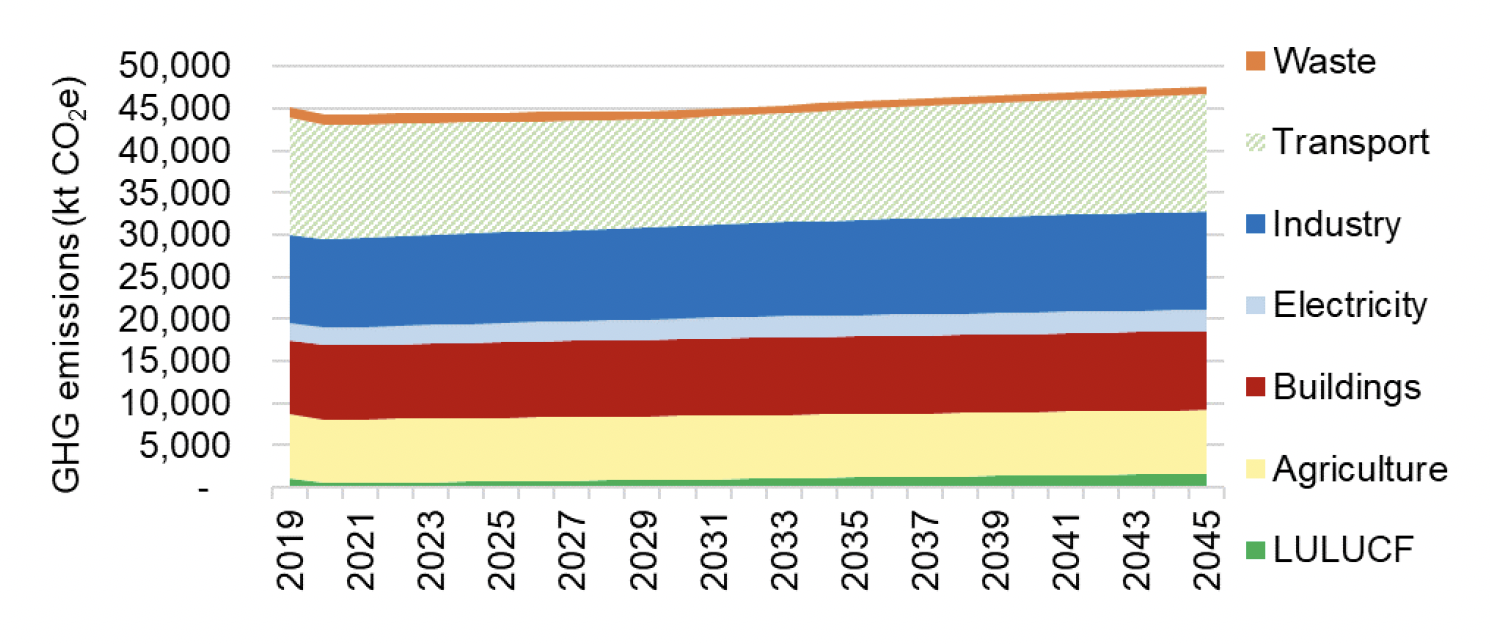
The results are described in subsequent tables and text
Step 4: Next, the impacts of CCPu policies and proposals were assessed by sector experts from Ricardo and CEH. The precise methodology that was used to quantify emissions reductions from each policy/proposal depended on whether the policy had already undergone a full impact assessment, and if not, what level of data was available to support such an assessment. Further information on the approach taken for each sector is provided in subsequent chapters of this report.
When assessing the impacts of CCPu policies/outcomes, a wide range of variables were considered, including: improvements in energy efficiency, fuel switching, product substitutions and phase outs, changes in transport modes, reductions in demand, material usage and waste production, increased digitisation, electrification, carbon capture & storage and negative emissions technologies (NETs).
For the purpose of this assessment, some policies have been grouped into "packages". A "package" refers to a collection of policies where the combined impact of the policies has been quantified, but disaggregated results are not provided.
This approach was adopted for the following reasons:
- In some cases, different policies are aimed at tackling similar issues. Where they overlap, there would be a risk of double-counting if the policies were quantified separately. For example, the Scottish Government has a variety of funding schemes in place to promote uptake of zero direct emission heating (ZDEH) systems. Separately, there is an ambition for all buildings to switch to ZDEH. The former would contribute towards the latter; therefore, it makes more sense to assess the policies in combination.
- Some policies and proposals essentially serve as "supporting measures", where there is no quantifiable target or outcome even if they still help to achieve the Scottish Government's goals. An example would be requiring Local Authorities to produce Local Heat and Energy Efficiency Strategies (LHEES). These would facilitate the deployment of solutions such as heat networks but would not directly result in GHG emissions reductions. Policies that were deemed unquantifiable have either been screened out of the assessment or included in packages as "supporting measures".
In this context, one of the benefits of modelling policies in groups is that it helps to reduce the level of uncertainty relative to trying to estimate the impacts of individual policies and then trying to correct for the interactions between them.
Step 5: Having established the baseline projection, and then calculated the impacts of CCPu policies/proposals, the work explored five additional future GHG emissions scenarios. In these scenarios, the Scottish Government's policies and proposals on climate change, as set out in the CCPu, act as mitigation measures that reduce GHG emissions. The scenarios reflect different assumptions on drivers and structural changes, and thus often assume different rates of action implementation.
A summary of each scenario is provided below, and further details on how this has been reflected in the modelling for each sector is provided in subsequent chapters.
| Scenario | Description |
|---|---|
| A central economic growth scenario | Economic growth assumptions are the same as in the baseline scenario, but the CCPu policies and proposals for each sector serve to mitigate GHG emissions. |
| A high economic growth scenario | Increased economic activity is assumed to result in higher emissions from industry and non-residential buildings, as well as increased travel demand, when compared against the central scenario. This would tend to increase emissions. However, this is counteracted by the fact that higher economic growth could accelerate uptake of GHG reduction measures, such as ULEVs and energy efficiency in buildings. It could also lead to more capital funding becoming available to support GHG reduction initiatives. Greater deployment of NETs would be required to offset the increase in emissions. |
| A low economic growth scenario | The assumptions in the high economic growth scenario (see above) are reversed, such that there is generally lower demand for energy and transport, but also lower uptake of GHG reduction measures. |
| A high hydrogen availability scenario | In this scenario, there is a greater shift towards the use of hydrogen in the Industrial sector. Some hydrogen is also blended into the gas grid to heat buildings as an interim measure prior to the adoption of zero direct emission heating systems (ZDEH) – although note that this was only modelled in Phase 2 of the work (see below for an explanation of the "Phases"). It is also assumed that there would be higher growth in NETs since more BECCS would be needed to produce the hydrogen. |
| A low hydrogen availability scenario | In this scenario, there is a greater shift towards electrification rather than hydrogen in the Industrial sector. It is also assumed that there would be lower growth in NETs since less BECCS would be needed to produce the hydrogen. |
Note: Hydrogen scenarios were only modelled for Buildings, Industry and NETs as these were the only sectors where future hydrogen availability was considered likely to have a significant on sector development and sectoral emissions.
Step 6: After the initial set of GHG projections were developed, in what will henceforth be referred to as Phase 1 of the project, a second iteration was carried out, which will be referred to as Phase 2. Phase 2 allowed for further refinements to the modelling, and notably introduced higher levels of ambition for some sectors, based on the intended outcomes set out in the CCPu.
In Phase 2 of the work, details of the updated modelling approach were agreed with the Scottish Government in a series of sectoral workshops. The workshops looked beyond the specific policies in the CCPu by considering approaches outlined in more recent policy papers, sector road maps and any relevant research and analysis of additional policy measures which the Scottish Government sector teams shared with Ricardo sector experts. Once the modelling assumptions were agreed, the GHG projections from Phase 1 were updated to provide a revised set of results.
As a shorthand for differentiating between them, Phase 1 may be considered the "Policies" phase while Phase 2 was the "Outcomes" phase – though for many sectors, Phase 2 only involved modelling refinements, as detailed in Table 3‑3 below.
Further details on the changes modelled in each sector are provided in subsequent chapters.
| Sector | Is there a difference between P1 / P2? | Description of additional modelling that was carried out in Phase 2 |
|---|---|---|
| Agriculture | Yes | Phase 2 consisted of modelling of outcomes, which included updates to the modelling assumptions (e.g., improved uptake estimates for better nitrogen use) rather than a change in the overall level of ambition. |
| Buildings | Yes | In Phase 1, we modelled the impacts of EPC upgrades to domestic buildings, and the proposed Heat in Buildings Regulation which would see all buildings switch to zero direct emission heating (ZDEH), alongside specific initiatives such as the Energy Company Obligation, smart meter installations, HiBS domestic and SME Delivery Schemes and the Scottish Green Public Sector Estate Scheme. In Phase 2, we modelled EPC upgrades to domestic buildings, reducing service sector fossil fuel demand to 5,000 GWh per year, and the entire building stock transitioning to ZDEH. Initiatives such as the HiBS domestic and SME Delivery Schemes were assumed to contribute to those outcomes so were not modelled separately. Also in Phase 2, the 'High Hydrogen' scenario explored the impact of blending up to 20% green hydrogen into the gas network by as an interim measure prior to the wider adoption of electrically powered ZDEH. |
| Electricity | Yes | In Phase 2 the following changes were made:
|
| Industry | No | Some modelling changes were adopted, but these were applied retroactively to the Phase 1 modelling as well, so there is no difference in results for Phase 1 and Phase 2 |
| Sector | Is there a difference between P1 / P2? | Description of additional modelling that was carried out in Phase 2 |
|---|---|---|
| Transport | Yes | In Phase 2 the following changes were made:
|
| Waste | No | No additional modelling was carried out for Phase 2 of this work, as no further quantifiable policies/targets could be identified. |
| NETs | No | No additional modelling was carried out for Phase 2 of this work, as no further quantifiable policies/targets could be identified. |
| LULUCF | No | No additional modelling was carried out for Phase 2 of this work, as no further quantifiable policies/targets could be identified. |
The baseline projection is consistent between the two Phases.
It is important to note that some outcomes are not supported by enough specific policies or proposals in the CCPu to enable them to be achieved. Some of the policies or proposals that have already been published are nonetheless at an early stage of development where the regulatory approach, funding, etc. has not yet been confirmed. The impact on GHG emissions will depend on the specific technologies and solutions that are ultimately adopted. All of the quantified GHG impacts set out in this report are therefore subject to confirmation of the regulatory approach or policy design.
3.2 Comparison against the Scottish TIMES model
The table below briefly compares the modelling approaches used in the Scottish TIMES model and the bottom-up modelling approach used in this study delivered by the Ricardo Net Zero Gap Analysis Tool. This comparison provides an insight into the potential differences and comparability of outputs between the two modelling approaches, and the key limitations of each modelling approach.
| Topic | Scottish TIMES Model | Ricardo Net Zero Gap Analysis Tool |
|---|---|---|
| Strengths | Produces a cost-optimised net zero pathway based on the availability and relative cost effectiveness of technology-based mitigation measures. Adopts a whole system approach to optimisation, which is particularly useful when modelling energy transformations. | Produces an annual bottom-up estimate of policy impacts that is grounded in market realism and reflects views stakeholders as captured in sector roadmaps and research. Highly adaptable – can model wide range of mitigation measures at high or detailed level. Short run times, with low data requirements. |
| Weaknesses | Assumes perfect market in which all cost- effective technologies are taken up by users and no supply chain limitations (other than those built into the model through construction times, asset lifetimes, exogenous constraints, etc). Data gathering can take several years as require comprehensive data on economy and mitigation measures. Long run times. | "Optimisation" is done off model by modeller via a stakeholder consultation exercise (known as "back casting"). Non-linear market dynamics and sector interactions are linearised to reduce data input requirements. Additional detail can be added by modelling policy implementation in phase, for example. However in practice, the level of technical detail is usually limited by stakeholder knowledge and budget. |
| Limitations | Pathway optimisation is done at a whole economy level with outputs generated every 5 years to reduce model run times. Energy & materials flows across system boundaries are fixed to limit complexity. | Pathway optimisation is done using scenarios that may be based on unrealistic expectations and conservative estimates. Energy & materials flows across system boundaries are fixed to limit complexity. |
| Options | Deployment of specific technologies can be constrained by the user through resource constraints or technology and resource costs, or by increasing the resolution of technology supply curves. | Can be used to support an open and transparent discussion with stakeholders on expectations, and policy & technology gaps. More technical detail can be added to support decisions, including cost analysis. |
Further information on the limitations, uncertainties and sensitivities that apply to each sector are provided in subsequent chapters.
Contact
Email: Edward.Mchardy@gov.scot
There is a problem
Thanks for your feedback