Greenhouse gas emissions projections: phase 1 and phase 2 modelling results
Analysis undertaken by Ricardo-AEA for the Scottish Government to provide an estimated projection of Scottish emissions from 2019 to 2045 which capture announced Scottish and UK policies.
6. Electricity sector
6.1 Sector Overview
6.1.1 Sector Background
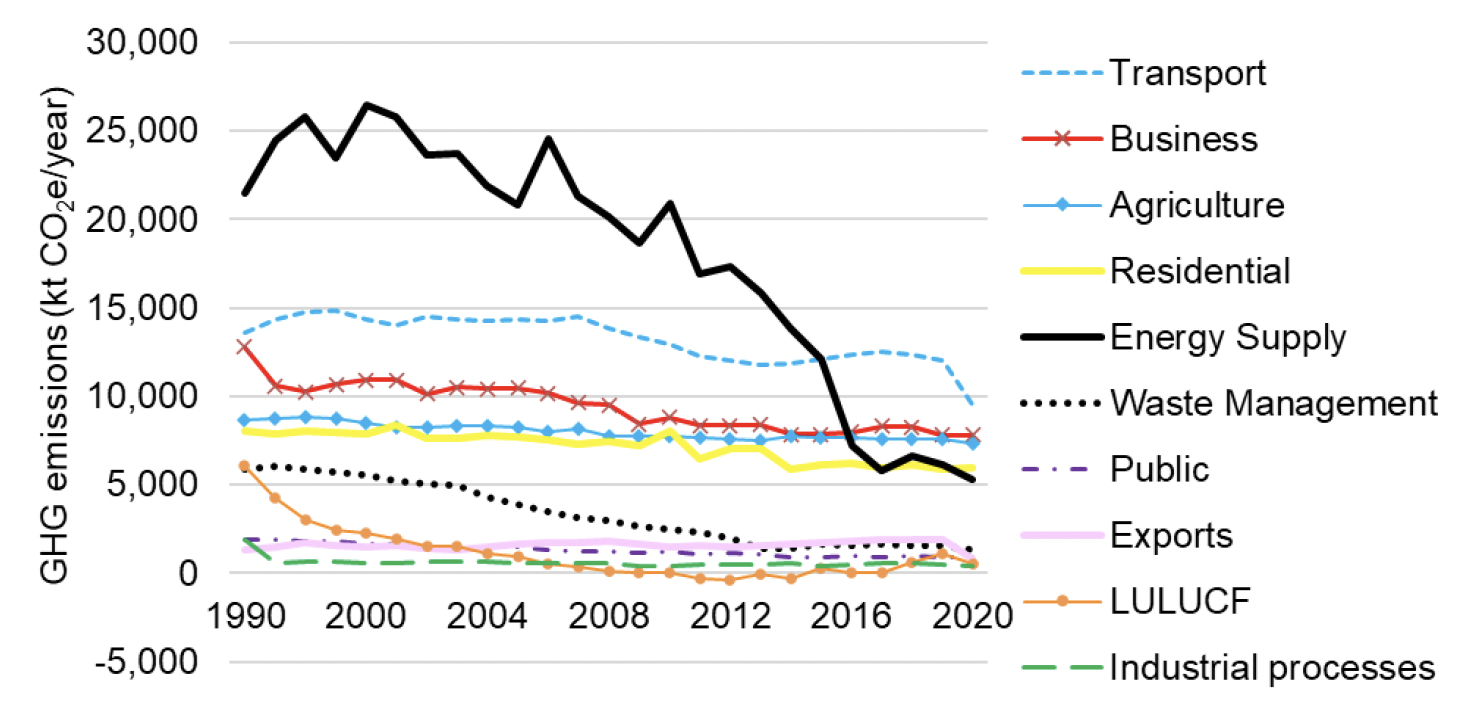
The Electricity sector has seen significantly greater progress with decarbonisation, through closure of fossil fuel power and switching to renewables, than any other sector, as illustrated below. This is primarily due to the phase-out of coal to generate electricity, in favour of gas and renewable energy technologies.
Policy change here is aimed not so much at transformation (which has happened) but expansion to support electrification of vehicles, space conditioning, and hydrogen production. Changes in electricity price through external geopolitical events, as much as through policy, are already making further renewables investments very attractive, and the cost-effectiveness of wind, solar and other marine technologies is improving all the time.
The CCPu includes 23 electricity policies, of which only one is proposed for a full assessment - the Offshore Wind Policy Statement, which includes a range of actions that are designed to support the development of between 8 and 11 GW of offshore wind. The additional electricity generated by the growth of offshore wind is not used to estimate the amount of electricity generation offset from power plants that release emissions. The other policies are not assessed.
6.1.2 Subsectors Considered
The Electricity sector's capacity was disaggregated into the following subsectors:
- Non-renewable;
- Nuclear; and
- Renewable.
The structure of the Electricity sector and technology supplying capacity, as modelled in this study, is shown in Figure 6‑2 below. This study has a baseline of 2019 with the latest forecast year of 2032 as such all types of technology contributing capacity over this period have been included.
Figure 6‑2: A visualisation of the disaggregation of the Electricity sector
Non-renewable
- Peterhead (gas power station)
Nuclear
- Hunterston
- Torness
Renewable
- Wind
- Solar
- Hydroelectric
- Tidal
- Bioenergy
6.1.3 Data Sources
The main data sources used to undertake the assessment of the Electricity sector in Scotland are detailed in Table 6‑1 below.
| Purpose | Data used | Comment |
|---|---|---|
| GHG inventory for Scotland | UK National Atmospheric Emissions Inventory (UK NAEI) | GHG inventory for Scotland needed to estimate impacts of policies on emissions from all electrical generation technology including bioenergy The bioenergy emission factors are only based on scope 1 emissions. |
| Capacity and electricity generation for Scotland | Scottish Energy Statistics (gov.scot and BEIS). BEIS regional data are published in Energy Trends together with Quarterly Estimates. | Provides capacity and electricity generation for different technologies. This is used to establish what the actual baseline (2019) electricity generation is for Scotland. |
| Future year capacity and electricity generation without CCPu policies | BEIS: Renewable energy planning database (REPD) | Provides capacity growth for different technologies. This is used to forecast what the future baseline (2045) electricity generation is for Scotland. The methodology used to forecast future energy generation is provided in the section 'Underlying drivers of energy and emissions'. |
| Establish load factors for proposed renewable capacity committed in planning and in CCPu policies | BEIS: Energy Trends (published 31/03/2022) | Used to establish load factors, which refer to the percentage of electricity generation out of the maximum annual potential. The methodology used to forecast future energy generation is provided in the section 'Underlying drivers of energy and emissions' and 'policy measures'. |
6.1.4 Underlying Drivers of Electricity & Emissions
The underlying drivers of electricity demand are related to energy use in buildings and industry, transport electrification, and associated energy efficiency. The drivers of emissions associated with electricity supply is the technology used for generation in Scotland. There is a trend towards renewable capacity in Scotland, with the decommissioning of the Hunterston (2022) and Torness (2028) Nuclear power stations and Lerwick Power station (2024). Further to this, emergence of carbon capture and storage (CCS) technologies will reduce greenhouse gas emission rates with a CCS gas power station which could replace the existing Peterhead gas power station in 2027 at the earliest. The capacity of renewables in the planning pipeline more than offsets the lost capacity of decommissioning the Peterhead gas power station. Whilst non-renewable capacity is offset by renewables, due to the intermittent nature of renewables there is a risk that capacity – including system balancing and wider system security – will need to be met by non-renewable technologies such as Peterhead CCS. DUKES UK power station records[23] were used to establish the loss of electrical capacity associated with decommissioning power plants and BEIS' renewable energy planning database (REPD)[24] was used to forecast capacity that has received planning permission. (Note that not all technologies that are listed in the REPD as having obtained planning permission will necessarily become operational.) In the BEIS renewable energy planning database all renewable technologies awarded planning permission, but not operational in 2019 have been included in the future generation. It was assumed that the difference between electricity generation in 2019 and future generation would have linear growth until 2032.
The following assumptions were made when forecasting the energy generation from different technologies:
- The 2019 MWh generated per GW capacity of all power station types was assumed to remain constant.
- Emissions from biomass were considered at the point of combustion rather than in terms of net lifecycle emissions.
- The load factors for additional capacity of renewable technologies, i.e. those that will be added in future years, were based on the 10-year average load factors between 2012-2021 for technologies that were awarded planning permission as reported in the BEIS Energy Trends[25] publication. These are set out below:
- Offshore wind: 36%
- Onshore wind: 26%
- Tidal energy: 4%
- Hydroelectric: 36%
- The electricity generation potential of Peterhead and associated emission factors were taken from the Environmental Statement.
6.2 Policy Measures and Outcomes Modelled
6.2.1 Phase 1 – Policy Measures
For the Electricity sector there were a total of 23 policies to be assessed. The policies were grouped into 3 packages covering similar themes, to allow policies targeting the same measures to be assessed together and thus ensure interactions between similar policies/proposals were captured. For example, there are multiple policies with targets for renewable energy generation from specific technologies and in general, all of which will have a combined effect on Scottish Government's ambitions for renewable energy generation. Grouping policies into themes, as below, allows such interactions to be identified and addressed. Note that many of the policies were deemed unquantifiable and screened out of the assessment. A total of three policies were compiled into two packages, but two of these policies were deemed to not have a quantifiable impact on the Electricity sector (either because no target was set, or because the impacts are expected to be on demand sectors). Table 6‑2 below shows the packaging of policies into key themes, and the quantifiable targets informing the assessment. Only the offshore wind policy has been taken forward.
| Theme | Quantifiable targets | Relevant policies / strategies / actions |
|---|---|---|
| Renewable electricity in Scotland | ||
| Policies not assessed | Targets:
|
|
| Policies assessed | Targets:
|
|
| Scotland's Renewable electricity exports | ||
| Energy efficiency policies (not assessed) |
|
|
6.2.2 Phase 2 – Outcomes
Representatives of the Scottish Government and Ricardo Energy & Environment (REE) discussed options for modelling additional outcomes and targets as part of Phase 2 of the Provision of Emissions Projections project during a workshop.
Some of the policies modelled as part of Phase 1 are expected to contribute to the targets that were modelled in Phase 2. The timing of the new Carbon Capture and Storage gas power station at Peterhead coming online was discussed and amendments to renewable and non-renewable generation load factors were discussed and agreed.
Table 6‑3 below shows the additional impacts that were considered during Phase 2. These are predominantly based on the policy outcomes and targets listed in the Climate Change Plan Monitoring Report 2022, although they have been modified to reflect subsequent discussions between Ricardo and Scottish Government.
| Outcome | Additional impacts modelled |
|---|---|
| 1. The electricity system will be powered by a high penetration of renewables, aided by a range of flexible and responsive technologies. | The proposed CCS at Peterhead was previously modelled as coming online in 2033. This has now been modelled as coming online in 2027. 10-year average load factor changed to reflect BEIS' projected load factors in electricity generation costs[26]. |
| 2. Scotland's electricity supply is secure and flexible, with a system robust against fluctuations and interruptions to supply. | Not quantifiable |
| 3. Scotland secures maximum economic benefit from the continued investment and growth in electricity generation capacity and support for the new and innovative technologies which will deliver our decarbonisation goals. | Not quantifiable |
During the sector workshop, other fossil fuel plants generating electricity were discussed and consideration was given to how emissions could be reduced further, in particular offsetting diesel generators with battery storage for emergency back-up power and grid stabilisation. After an internal review, it was not considered feasible for a sufficiently accurate fossil fuel generation displacement calculation to be included as part of this project. The reasons why we reached this conclusion are related to a lack of data on:
- The round-trip efficiency of battery storage.
- Whether the sites will be completely charged by renewable energy.
- The purpose of the battery storage sites (Grid Balancing, Time Shifting, Backup Power, Black Start) and the nature of proposed grid service contracts (response/reserve and firm/optional).
6.2.3 Summary of Policy Packages
The table below indicates which policies were found to have the biggest potential impact within each package, which policies overlap with (or reinforce) each other, and which policies act as supporting measures.[27]
Electrification, which is key to reducing emissions from the Buildings, Transport and Industry sectors in particular, will rely on access to a secure, reliable source of renewable electricity. The Electricity sector policies in the CCPu can therefore be said to reduce emissions from multiple sectors indirectly, inasmuch as they minimise the need to generate electricity using unabated fossil fuels. The largest impacts in this sector that have been assessed in this study are associated with (a) to the Peterhead gas power station being decommissioned and replaced with a carbon capture, storage and utilisation gas power station and (b) additional offshore wind capacity.
| Policy | Categorisation |
|---|---|
| N/A - this package covers planned changes to the electricity generation mix not covered in CCPu policies | N/A |
| Policy | Categorisation |
|---|---|
| Policy 1: Support the development of a wide range of renewable technologies by addressing current and future challenges, including market and policy barriers. | Supporting measure |
| Policy 2: Support improvements to electricity generation and network asset management, including network charging and access arrangements that encourage the deployment and viability of renewables projects in Scotland. | Overlapping/reinforcing measure |
| Policy 3: Publish a revised and updated Energy Strategy, reflecting our commitment to net zero and key decisions on the pathways to take us there. | Overlapping/reinforcing measure |
| Policy 4: Develop and publish a Hydrogen Policy Statement by the end of 2020, followed by a Hydrogen Action Plan during 2021. | Supporting measure |
| Policy 5: A new renewable, all energy consumption target of 50% by 2030, covering electricity, heat and transport. | Overlapping/reinforcing measure |
| Policy | Categorisation |
|---|---|
| Proposal 1: Introduce a new framework of support for energy technology innovation, delivering a step change in emerging technologies funding to support the innovation and commercialisation of renewable energy generation, storage and supply. | Supporting measure |
| Proposal 2: Renewed focus on developing local energy projects and models, including through CARES, supporting the achievement of 1GW and 2GW of renewable energy being in Local Community ownership by 2020 and 2030. | Supporting measure |
| Proposal 3: We will carry out detailed research, development and analysis during 2021 to improve our understanding of the potential to deliver negative emissions from the electricity sector. | Supporting measure |
| Proposal 4: We will continue to review our energy consenting processes, making further improvements and efficiencies where possible, and seeking to reduce determination timescales for complex electricity generation and network infrastructure applications. | Overlapping/reinforcing measure |
| Proposal 5: We will deliver the actions from our Offshore Wind Policy Statement, published in October. These actions, ranging from support for supply chain, planning, innovation and skills, will support the development of between 8 and 11 GW off offshore wind capacity by 2030. | Key policy |
| Proposal 6: Accelerate our work with aviation, energy and other stakeholders to ensure that all radars are wind turbine tolerant/neutral during the coming decade. | Supporting measure |
| Proposal 7: Review and publish an updated Electricity Generation Policy Statement ahead of the next Climate Change Plan. | Supporting measure |
6.2.4 Variation across scenarios
Economic growth is assumed to dictate how much offshore wind can be delivered (the only quantifable policy for the electricity sector). As the offshore wind farm policy aims to introduce between 8 to 11 GW of electricity capacity by 2030, 9.5GW was assumed to be achieved in the central scenario, the maximum of 11GW was assumed to be achieved under high growth, and the minimum of 8GW was assumed to be achieved under the low growth scenario. Hydrogen scenarios were not explored for this sector. It should be noted that the offshore wind capacity that has been awarded planning permission between 2019 and 2022 has not been discounted from the additional GW capacity associated with this policy. Consequently, there is a chance that the impact of the offshore wind farm policy is over-represented based on the level of ambition set out above.[28]
6.3 Emissions Projections
6.3.1 Phase 1 results
Under all scenarios the quantifiable CCPu offshore windfarm policy has no impact on GHG emissions in the modelled implementation year and all subsequent years (Figure 6‑3). However, there is a slight dip in emissions in 2024 and a substantial decrease in 2033 in the central, low and high scenarios. This is due to existing commitments to decarbonising Scotland's energy supply and that the additional offshore windfarms already committed in planning provide sufficient capacity for forecasted energy demands. The decarbonisation plans are:
- The diesel power station on Lerwick is being moved to becoming a backup station in 2024 and for supply to be replaced with a connection to the national grid.
- The gas power station at Peterhead is to be replaced with a CCS gas power station in 2027. However, for consistency with the other CCS measures this has been introduced in 2033.
Decommissioning of the diesel power station in Lerwick and replacement of the Peterhead gas power station with a CCS gas power station are committed policies and should appear in the baseline. However, model configuration means that changes to electricity generation and emissions can only be reflected in the scenarios. For clarity on the implications of this model configuration on results, the CO2e emission decrease in 2024 and the substantial decrease in 2033 are associated with the CCS power station replacement at Peterhead, the aforementioned CO2e decrease is not associated with the implementation of the offshore windfarm policy (the only quantitatively assessed CCPu electricity policy). (Note: the implementation date of the CCS retrofit at Peterhead is modified to be 2027 in the refined Phase 2 modelling – see Section 6.2.2).
The impact of the CCPu offshore wind farm policy is very clear when comparing the baseline and central scenario energy use charts in Figure 6‑4 and Figure 6‑5.
The central scenario will result in approximately 14 million additional MWh in electricity by 2045, compared to the baseline. The low and high scenario also increase renewables' MWh generated by 10 and 19 million MWh, respectively. The additional offshore capacity (3.9 GW) granted planning permission between 2019 and 2022 have not been discounted from the GW capacity introduced by the CCPu offshore wind farm policy, this may be discounted in reality, consequently the GW capacity from this policy may be an overestimate (ranging from 4.1 to 7.1 GW).
Note: The results from the three growth scenarios are visibly almost indistinguishable from each other because of the small magnitude of differences between them.
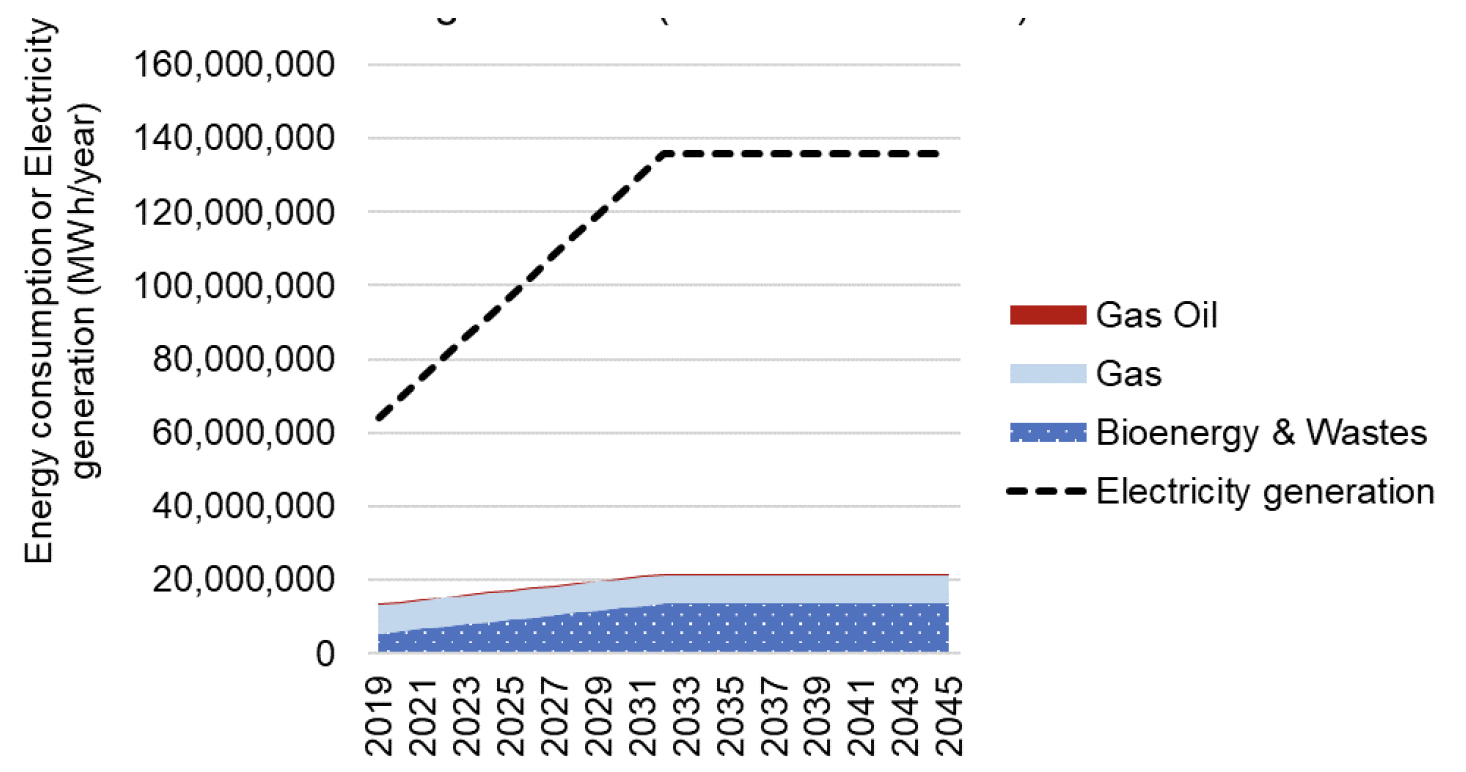
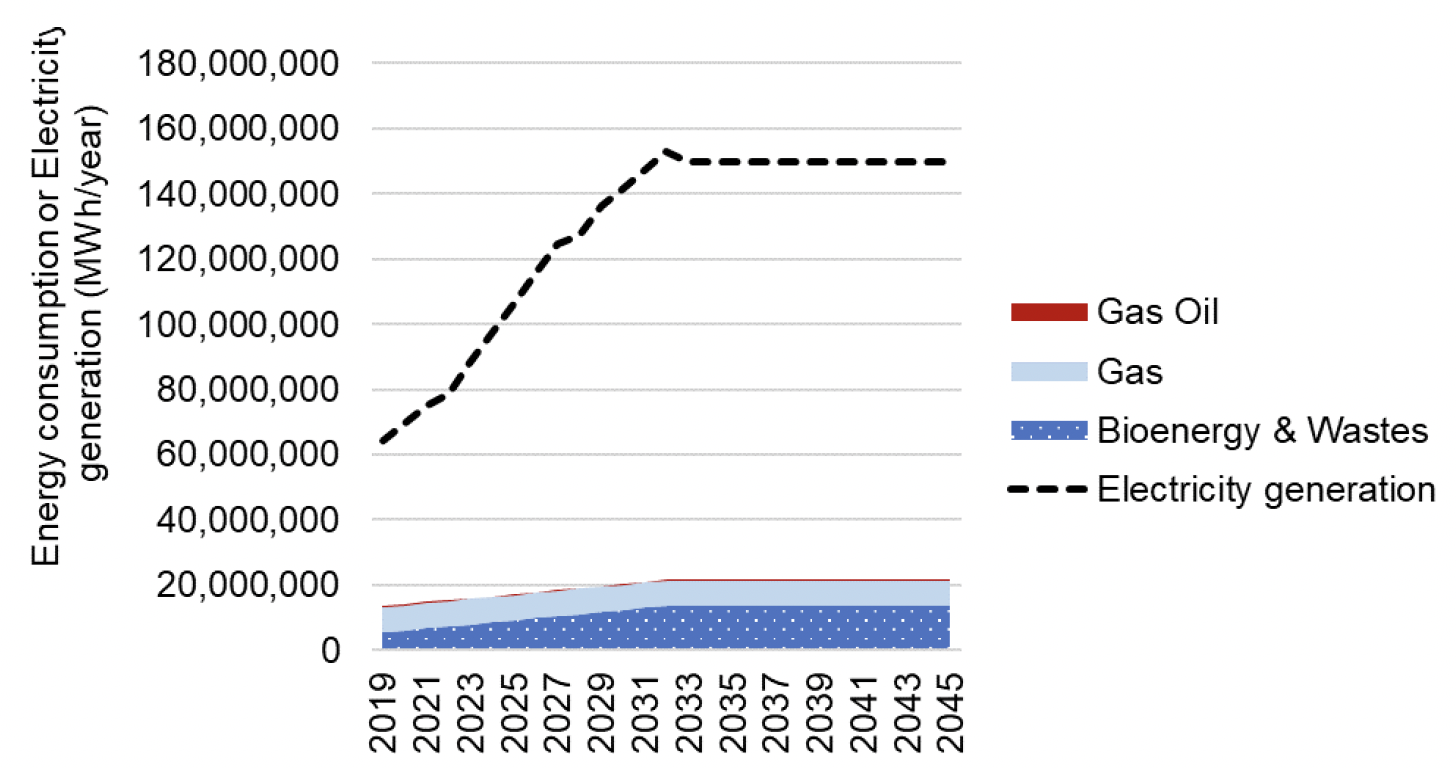
Note: In Figure 6‑4 and Figure 6‑5 the gap between electricity consumption and electricity generation is accounted for by renewable electricity generation (not associated with a fuel).
6.3.2 Phase 2 results
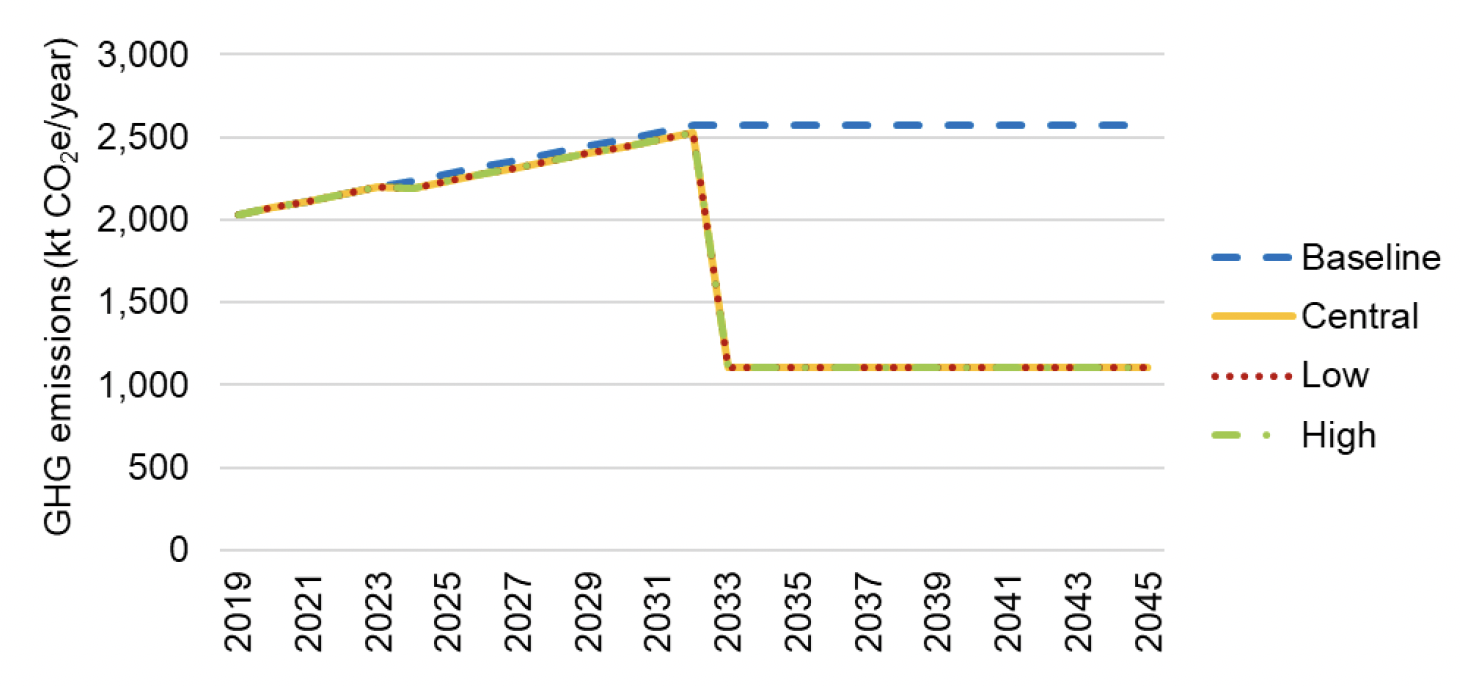
Results for the Electricity sector are shown in Figure 6‑6 below. In the baseline scenario, emissions from electricity rise by 26% by 2045, from 2,032 kt CO2e in 2019 to approximately 2,570 ktCO2e. The main driver for the increase in CO2 is a 2035 bioenergy and waste source projected load factor of 80.7% derived from BEIS. The baseline energy use is based on DUKES 2019[29] energy statistics from biomass. Energy use is substantially increased by the projected load factor of 80.7% factor (compared to previous load factors considered/modelled) which takes measured bioenergy and waste energy use from 5,486 GWh in 2019 to 13,624 in 2045. The impact of the projected load factor causes an increase of 498 kt CO2e emissions between 2019 to 2032.
Phase 1 baseline (2019) electricity generation was assumed constant up to the target year (2032) as there was no growth in bioenergy electrical capacity or load factor. However, in phase 2 it was assumed that there would be growth between baseline bioenergy electricity generation to the target year, as the load factor was forecast to increase from the observed value of 54.4% in 2019, to 80.7% using BEIS' projected load factor in 2032. However, there was no growth in bioenergy electrical capacity. The projected load factor was applied to total bioenergy electrical capacity which caused an increase in CO2 emissions. It should be noted this approach deviates from Scottish Government's of applying historical observed load factors to existing plant in future years, as this study has assumed that existing plant will reach BEIS' projected load factors. The forecast emissions from bioenergy do not account for forecasted CCS capabilities detailed in Section 10.
There is a slight decrease in carbon emissions in the low, central and high scenarios in 2024 as a result of the Lerwick diesel power station being decommissioned. This featured in Phase 1 and is not a decrease in carbon emission introduced in Phase 2.
The impact of the additional measures can be seen in 2027 when the new Peterhead CCS plant comes online and drops carbon emissions in the Electricity sector from 2,276 to 900 kt CO2e. The transition to CCS at Peterhead reduces carbon emissions by 1,376 kt CO2e.
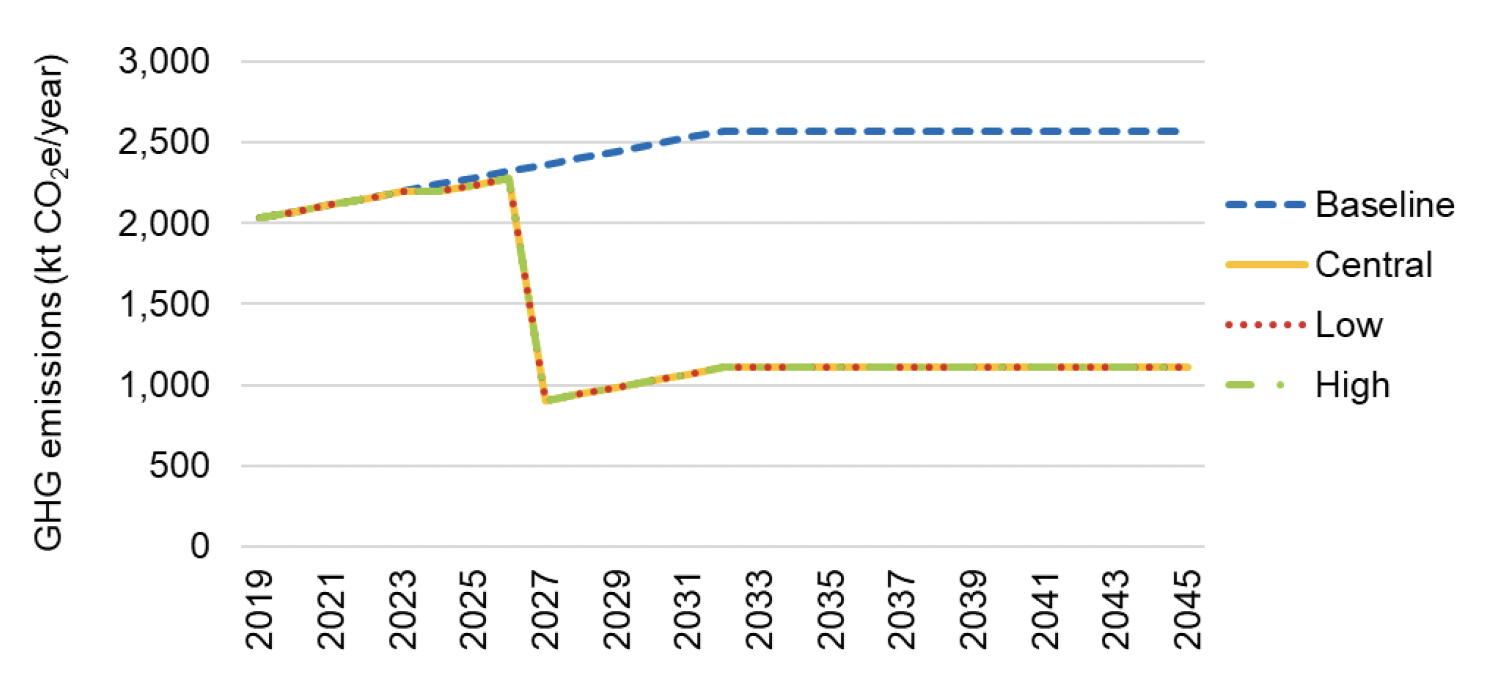
Note: The results from the three growth scenarios are visibly almost indistinguishable from each other because of the small magnitude of differences between them.
Overall, the Phase 2 results support the findings of the Phase 1 modelling, which found that the most significant impacts are achieved by introducing a new CCS gas turbine plant at Peterhead. The decrease in carbon emissions with only the CCS online at Peterhead is 1,376 kt CO2e per annum. With the CCS replacement at Peterhead coming online in 2027 rather than 2033, there will be a cumulative removal of 8,256 kt (1,376 x 6) CO2e between 2027 and 2033. However, BEIS' projected electricity cost load factors have resulted in a substantial increase in per annum electricity generation and carbon emission compared to the Phase 1 methodology of extrapolating 2019 biomass electricity generation and carbon emissions.
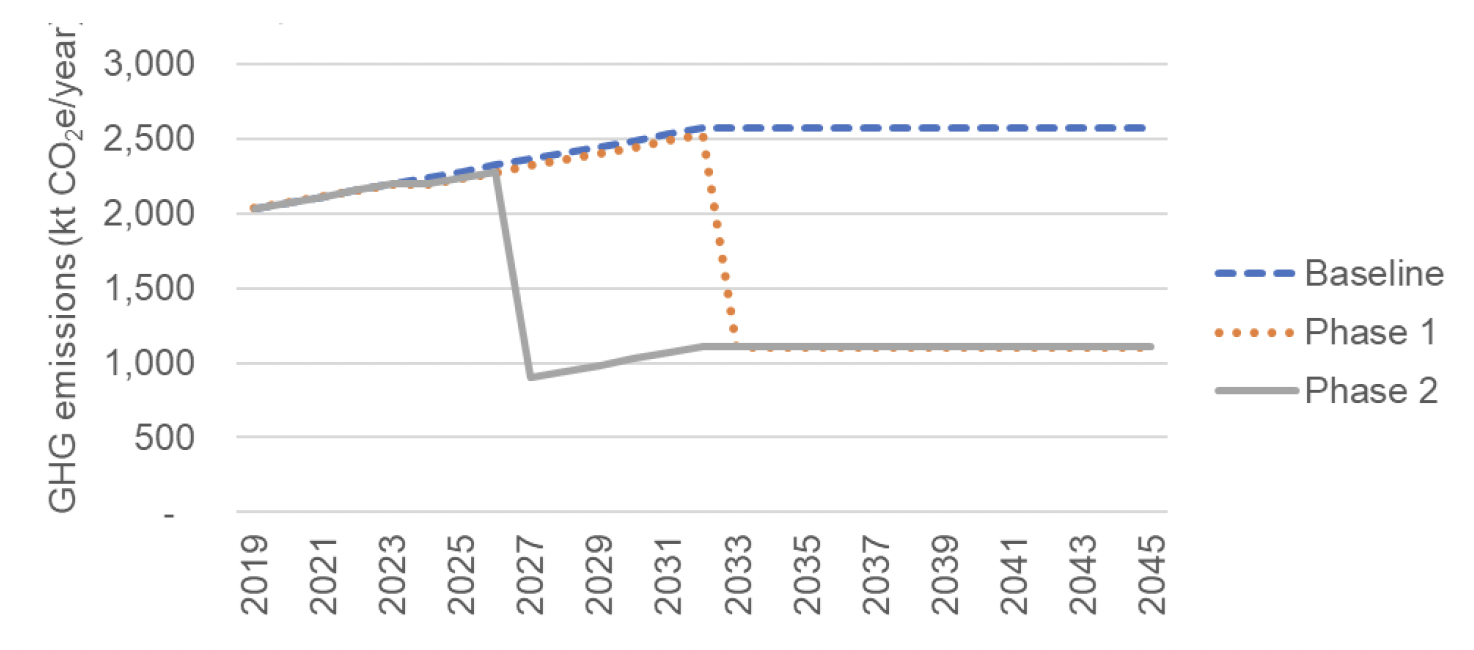
6.3.3 Comparison of Phases 1 & 2
Emissions projections from the Electricity sector for all scenarios in Phases 1 and 2 of the project are provided in Table 6‑7, below.
| Phase | Scenario | Emissions (ktCO2e) | ||||||
|---|---|---|---|---|---|---|---|---|
| 2019 | 2020 | 2025 | 2030 | 2035 | 2040 | 2045 | ||
| n/a | Baseline | 2,032 | 2,072 | 2,279 | 2,487 | 2,570 | 2,570 | 2,570 |
| 1 | Central Growth | 2,032 | 2,072 | 2,234 | 2,442 | 1,108 | 1,108 | 1,108 |
| High Growth | 2,032 | 2,072 | 2,234 | 2,442 | 1,108 | 1,108 | 1,108 | |
| Low Growth | 2,032 | 2,072 | 2,234 | 2,442 | 1,108 | 1,108 | 1,108 | |
| 2 | Central Growth | 2,032 | 2,072 | 2,234 | 1,025 | 1,108 | 1,108 | 1,108 |
| High Growth | 2,032 | 2,072 | 2,234 | 1,025 | 1,108 | 1,108 | 1,108 | |
| Low Growth | 2,032 | 2,072 | 2,234 | 1,025 | 1,108 | 1,108 | 1,108 | |
6.3.4 Emissions reduction by policy package (2032) – Phase 1 & 2
For other sectors, there is a breakdown of emissions into policy groups in the Phase 2 assessment. In the Electricity sector, however, the only policy which has been explicitly modelled is the increase in offshore wind capacity and the planned changes to electricity generation mix (E0). Package E1 consists of supporting measures that were not explicitly modelled. Table 6‑7 and Table 6‑8 demonstrate the cumulative impact of all amendments to the phase 2 modelling work, this includes the replacement of 10-year average load factors derived from BEIS' operational data with BEIS' projected load factors and Peterhead coming online in 2027 instead of 2033.
A comparison between the projected emission reduction by 2032 is provided below. As detailed in the Phase 1 report, only offshore wind capacity targets were included in the "Full Assessment" and there are no Electricity sector targets to compare the impact of these amendments in Phase 2 against.
| Policy Package | Emissions reductions by 2032 (ktCO2e) | |||||
|---|---|---|---|---|---|---|
| Phase 1 | Phase 2 | |||||
| Central Growth | High Growth | Low Growth | Central Growth | High Growth | Low Growth | |
| E0 | -45 | -45 | -45 | -1,462 | -1,462 | -1,462 |
| E1 | 0 | 0 | 0 | 0 | 0 | 0 |
| Total | -45 | -45 | -45 | -1,462 | -1,462 | -1,462 |
6.4 Uncertainties
There is uncertainty regarding projections of electricity generation for power schemes that have received planning permission and projections of electricity generation from the offshore wind policy. The uncertainty comes in three forms for sites that have received planning permission:
- Will the load factor be representative of the proposed sites?;
- Will the constructed schemes achieve the desired capacity set out in planning?;
- Will the proposed schemes be constructed and operational by 2032?; and
- The annual rate of electricity generation is assumed to be linear between 2019 and 2032, in reality the growth will be non-linear and this affects the accuracy of generation estimates for intermediary years.
The uncertainty due to load factors is 4% as the maximum standard deviation is 4% across all renewable technologies. However, this is based on existing and current technologies and technological improvements is expected to increase the load factor (proportion (%) of year that the plant is generating electricity) and uncertainty associated with it. However, the increasing load factor of renewable technologies is likely to reduce usage of the CCS gas power station and therefore reduce GHG emissions. Further to this there is the uncertainty of whether the renewable operations awarded planning permissions will become operational. However, this has not been quantified in this project.
For renewable generation from the offshore wind policy, in addition to the above, there is also uncertainty around the capacity of sites that have already received planning permission that will be discounted from the 8 to 11 GW target. Taking a conservative approach, the maximum reduction this could have on the additional capacity (GW) constructed by this policy, energy generation could be reducing it by approx. 40%. As 3.76 GW of offshore wind farms have received planning permission and in 2019 are still waiting to become operational.
Built environment electricity demand:
As explained in Section 55, there are a variety of policies and targets in place that would see fossil fuel heating being phased out in favour of zero direct emission heating systems (ZDEH). However, at present, the precise mix of technologies is not known. Furthermore, some targets for buildings (e.g. reducing the emissions intensity of non-domestic buildings) could be achieved through demand reduction measures and/or switching to ZDEH, but again the regulatory approach has not yet been determined. This increases the level of uncertainty when it comes to electricity use in the built environment, both in terms of annual and peak demand. This could potentially have a significant impact on the Electricity sector's emissions because, if demands are significantly higher or lower, a different mix of technologies – potentially with a higher proportion of non-renewables – might be necessary to meet these demands. This, in turn, could impact on emissions from the Electricity sector.. Whilst there are substantial renewable generation projects in the planning pipeline that could fully meet the increasing demands from ZDEH, the intermittent nature of renewables in-combination with the lack of current capabilities to store excess electricity generation could lead to a greater reliance on CCS at Peterhead.
6.5 Sensitivities
GHG emissions in the Electricity sector are primarily sensitive to the carbon intensity of the Scottish electricity generation plants that are used to meet overall GB electricity demand, which is partially beyond Scotland's control. Scotland can contribute to grid decarbonisation by ramping up renewable installations. However, decisions as to which type of generating plant is dispatched at any given time is based on GB-wide demand and generating plant availability, along with availability of electricity and its price over the interconnectors in either direction. Reducing reliance on the one remaining CCS gas power station will mean that increasingly grid balancing will be met by renewable technologies and reduce GHG emissions associated with this.
Contact
Email: Edward.Mchardy@gov.scot
There is a problem
Thanks for your feedback